- Solutions
-
- File Server: Ransomware Protection
- File Server: File Copy
- File Server: Audit File Access
- File Server: Storage growth reporting
- Licensing/Pricing
- Contact
This help page is for version 9.1. The latest available help is for version 9.4.
The Plugin Monitor makes it easier to add custom monitors to PA Server Monitor. To make plugin reuse as easy as possible, this monitor is compatible with the output from Nagios plugins, which means many plugins from the Nagios Exchange will work. Not all plugins at the exchange will work - some need extra dependencies, and some don't follow the plugin output format properly.
Plugins are executable programs or scripts that can be run by the monitor. There are two types:
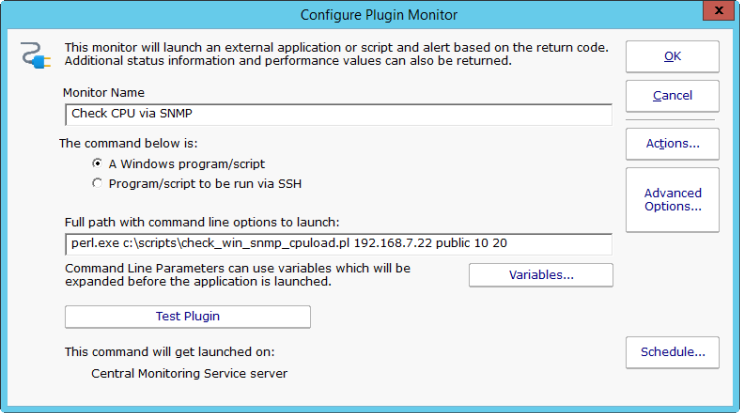
Plugin commands can use replacement variables in the command line which will be replaced before the command is run. For example, the following could be used as a monitor template:
Any program/script can be used as a plugin as long as it follows these rules:
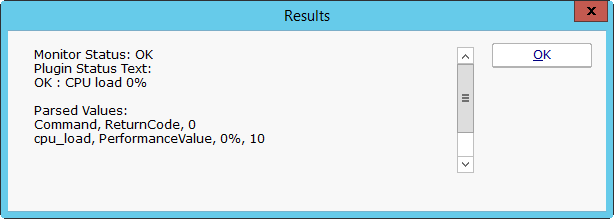
This monitor is compatible with Nagios plugins, which means the returned text (from stdout; stderr is ignored) as follows:
In all cases, the performance data must be formatted as:
Some examples:
Note that the 5;1; above is ignored since it comes after the threshold.
This plugin did not return any performance data - it's all status text. Also note that the plugin MUST return an exit code of 1 or 2 if the monitor is supposed to fire actions - the status text does not affect the monitor status.
The last line is performance data that will be parsed and stored in the database.
The Test Plugin button will run the plugin and show how the text was interpreted, and show the raw text that was received from the plugin. For SSH-run plugins, you will see a few lines of additional script code that are used to receive the output.
Like all monitors, this monitor has standard buttons on the right for Adding Actions, setting Advanced Options and setting the Monitor Schedule.

The Plugin Monitor can create reports based on the performance values returned from the plugin progra/script. This data can be charted as well as output in .CSV or HTML tabular form.