- Solutions
-
- File Server: Ransomware Protection
- File Server: File Copy
- File Server: Audit File Access
- File Server: Storage growth reporting
- Licensing/Pricing
- Contact
This help page is for version 8.1. The latest available help is for version 9.4.
The Settings dialog lets you configure global aspects of the monitoring service.
There are several dialogs that are reached by the buttons on the right side of this dialog and which are also accessible via the Settings menu.
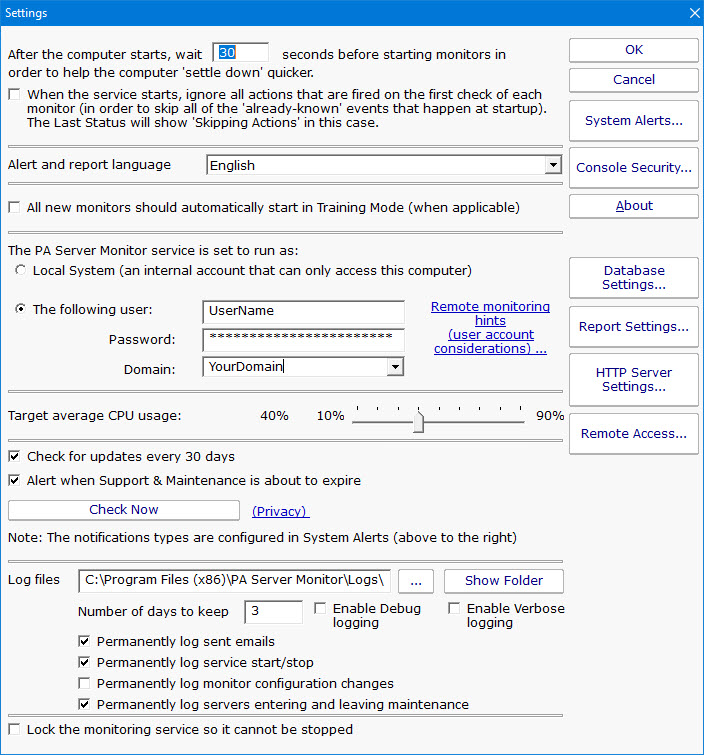
Startup Wait Time - When the monitoring service starts, you can instruct it to wait a number of seconds before active monitoring begins. This places less load on the system while it is starting, and also reduces false alarms that occur from the system not being completely started.
Ignore First Actions - To further reduce false alarms, the monitor service can ignore problems found on the very first run of each monitor. After the first run, all monitors will run normally.
Alert and Report Language - Change the display language for all of the reports and alerts.
Start in Training Mode - Most monitors support Automatic Training (see Advanced Monitor Options). When monitors are first created, they can automatically enter Training Mode. That is convenient in most cases, but it means the monitor might be a little harder to test initially since it won't fire actions until the training period has finished.
Service Account - This is a very important setting.
This setting lets you control which user account is used to run the monitoring
service (this is the same setting you can set on each service in the
Administrative Tools -> Services applet). This account is the account that the monitoring
service will use when monitoring all resources.
Note:
CPU Throttling - The monitoring service has advanced CPU throttling built in which works to keep the average CPU usage at or around the value you set. Note that during report creation, the CPU usage will sometimes go above the throttle level, but it won't stay there for long.
Update Check - The monitoring service can periodically check if a newer version of the software is available and notify you via an alert email Action. We take privacy seriously: Please see the privacy considerations built in to the update check.
Log Files - The monitoring service writes diagnostic log files as it runs. You can control the maximum size for the log file. When the maximum is reached, a portion of the beginning of the log file is removed and then new information continues to get written to the end of the file. Debug logging writes a very large volume of data to the log in a short time--it shouldn't normally be enabled unless needed by Power Admin Support to diagnose an issue.
Lock Monitoring Service - The monitoring service can be locked so it cannot be stopped. This prevents the service from being stopped using services.msc or the NET STOP command. It is still possible to uninstall the product. It is also still possible to upgrade and restart the service from the Console. To lock a Satellite Monitoring Service use the "Satellites: Lock Service (so service can't be stopped)" option in Bulk Config.