- Solutions
-
- File Server: Ransomware Protection
- File Server: File Copy
- File Server: Audit File Access
- File Server: Storage growth reporting
- Licensing/Pricing
- Contact
This help page is for version 10.0. The latest available help is for version 10.2.
The Modbus Monitor is a client that requests data from a Modbus capable device via TCP/IP.
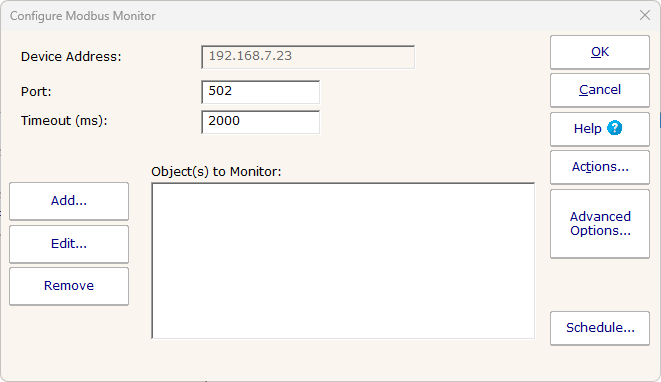
The address to connect to the device is taken from the device that the monitor is attached to. Specify the port to use to make the Modbus connection. Port 502 is the standard port, and the default.
You will need to define the objects to monitor based on documentation from the device manufacturer. Press the Add... button to do that. In the image below, a temperature monitor has been created for a PAPAGO 2TH ETH temperature probe which supports Modbus.
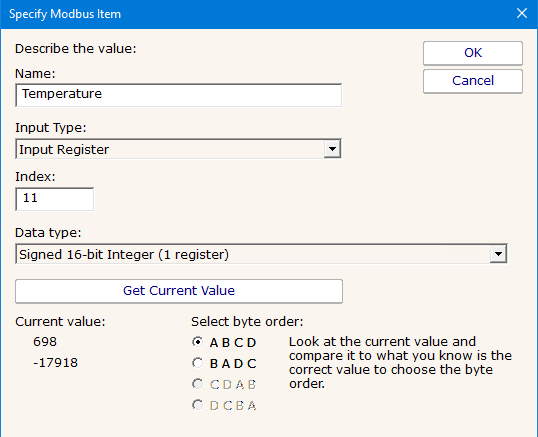
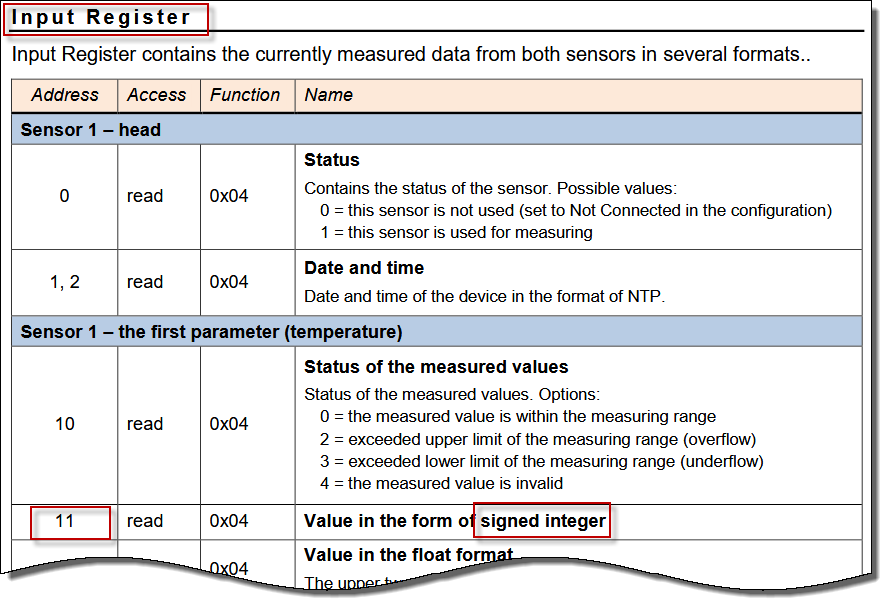
Compare these settings to the documentation for this particular probe.
The documentation doesn't specify byte order for the values so we requested the current value and then inspected the value to determine byte order. In this case the value is 10X the temperature in Fahrenheit. That will be adjusted for when the threshold is set.
Many devices can support multiple objects/metrics, and the various values are at different indices.
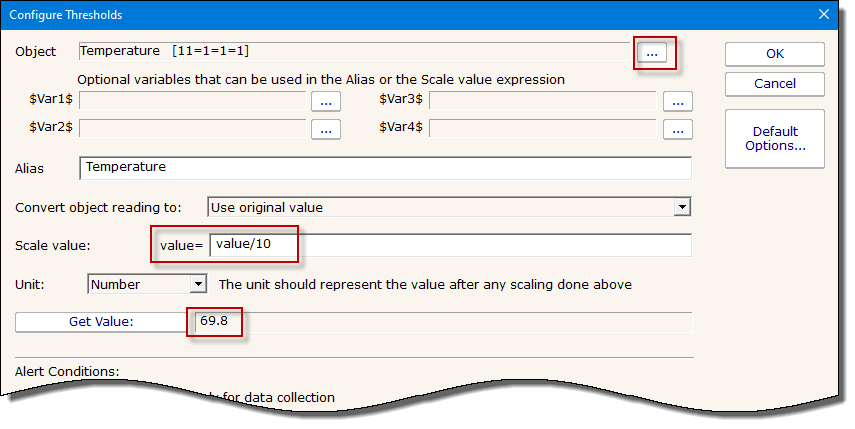
Once your target object has been found, press OK and you'll be shown the threshold dialog. Here you can make scaling/corrections to the values if needed by pressing the Advanced Options button (in our case we need to divide the value by 10 to get the current temperature).
If you need to go back and edit the metric definition, click the ... button to the right of the counter.
Each time a performance counter is measured and checked, it is also recorded in a database in order to generate historical reports.
If the counter value cannot be represented by an existing unit, you might be able to scale it. For example, imagine the counter is MBps, but the available unit is Mbps. To correctly record the value, you should set the scale to:
and then set the unit to Mbps
Like all monitors, this monitor has standard buttons on the right for Adding Actions, setting Advanced Options and setting the Monitor Schedule.
The Modbus monitor records values to the database. You can add charts from this data to the Server Status Report, and/or create Ad Hoc or Scheduled Reports to show line or bar charts, tabular data, or to export the data to CSV files.