This help page is for version 10.0. The latest available help is for version 10.2.
Service Status Pages
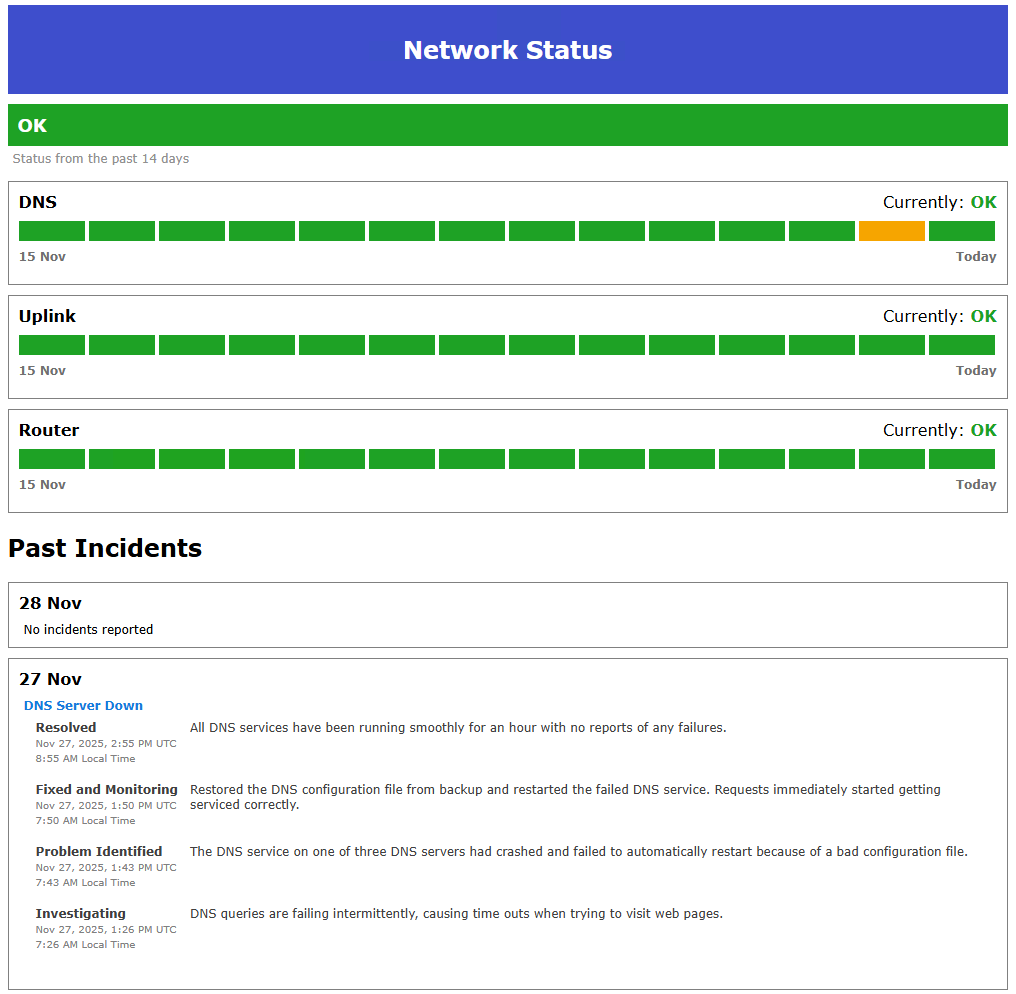
Status Pages provide a public-facing web page that displays the operational status of your monitored services. This allows you to communicate service health and past incidents to your users or customers.
The status page summarize the status of one or more monitors to show a high level view of a service that your organization provides, and shows the current and historical statuses, and incident reports
about any problems that happened.
Creating a Status Page
In the Console go to Advanced Services > Status Pages and right click and choose "Add New Status Page".
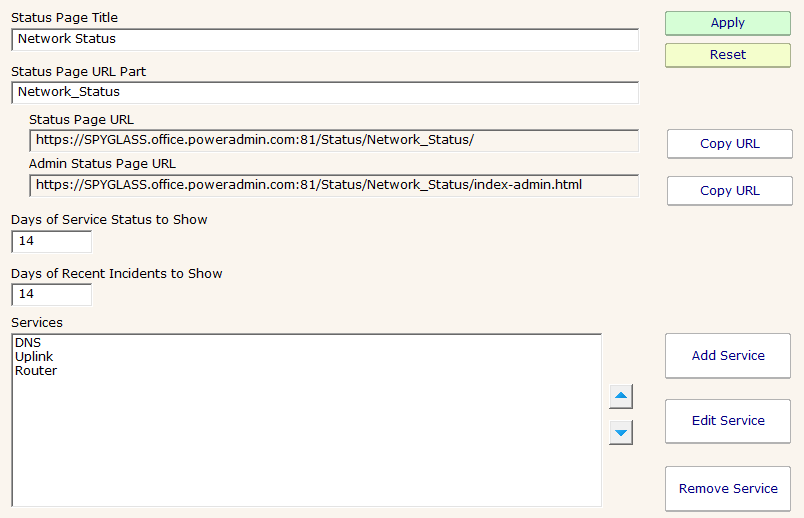
Configure the Basic Settings:
- Title - Enter a name for your status page (for example, "Company Services Status"). This title appears at the top of your status page.
- URL Part - This is automatically generated from the title, but can be customized. It becomes part of the status page URL. For example, "Company Services Status" becomes "Company_Services_Status", and the final URL will be
https://yourserver/Status/Company_Services_Status/
- Set History Duration:
- Days of Status History - The number of days of uptime/downtime data to display. The visual timeline shows daily status for each service. Note that your database must retain monitor history for at least this many days.
- Days of Incident History - The number of days of past incidents to show.
Adding Services
Services are the monitored components that are displayed on your status page. Each service can be composed of the status of one or more monitors.
Click Add Service in the Status Page configuration.
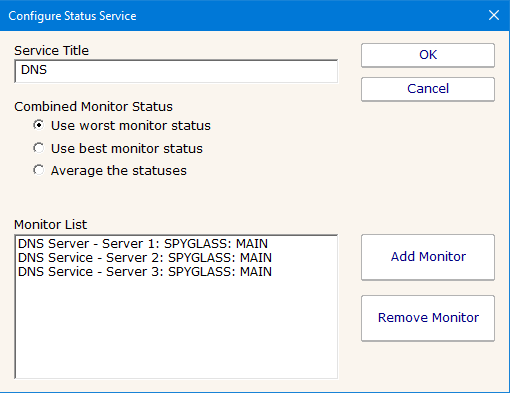
Configure the Service:
- Service Name - Enter a user-friendly name that will be displayed on the status page (for example, "Web Application", "Email Service", or "Payment Processing").
- Select Monitors - Choose which monitors contribute to this service's status. You can include multiple monitors from different computers.
- Choose Status Combination Method:
When multiple monitors are assigned to a service, select how their statuses should be combined:
- Worst - Service shows the worst status among all monitors. Use this for critical services where any issue should be flagged.
- Best - Service shows the best status among all monitors. This is useful for redundant systems.
- Average - Service shows the averaged status.
Use the up/down buttons to reorder how services appear on your status page.
After configuring all services, click OK to save and generate your status page. Copy the URLs:
- Public URL - Share this with your users or customers (for example, https://yourserver/Status/Company_Services_Status/)
- Admin URL - Use this for incident management (for example, https://yourserver/Status/Company_Services_Status/index-admin.html). This page requires authentication and appropriate permissions.
The status page is automatically generated and updated based on current monitor statuses.
Creating an Incident
Incidents are manually-created records that provide detailed information about service disruptions or planned maintenance. To create an incident, navigate to your status page's admin URL.
You must have the "Can Edit Status Incidents" permission.
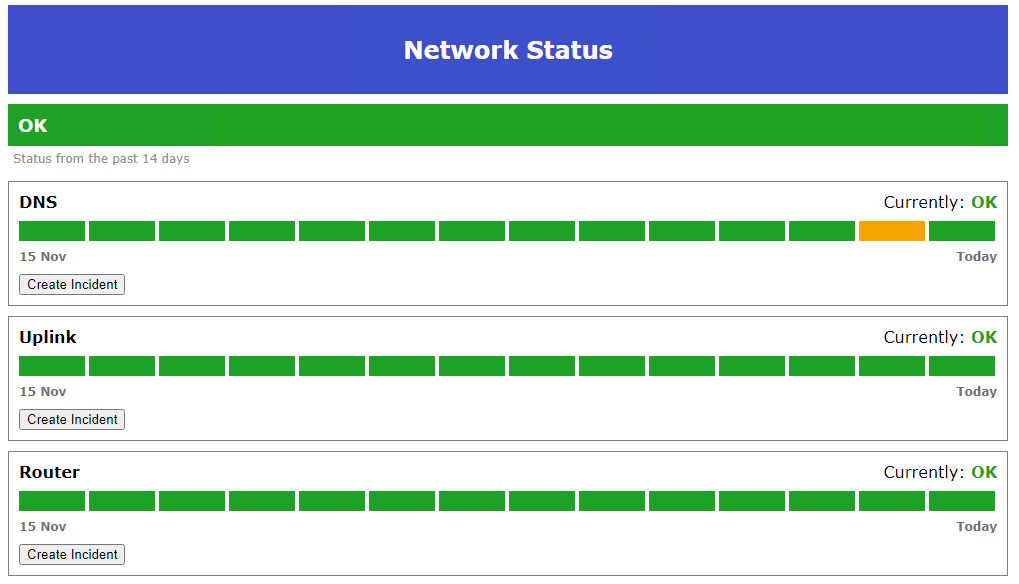
Click the Create Incident button next to the affected service, and enter incident details:
- Title - A brief description of the issue (for example, "Database Connection Issues" or "Scheduled Maintenance").
- Visible - Check this to make the incident visible to the public. Uncheck it for internal-only tracking.
- Click Submit Changes to save the Incident and begin editing an Update
Updates are individual time stamped lines within the incident to help users/customers know what is happening. Enter the following details. You will be able to edit these later if needed.
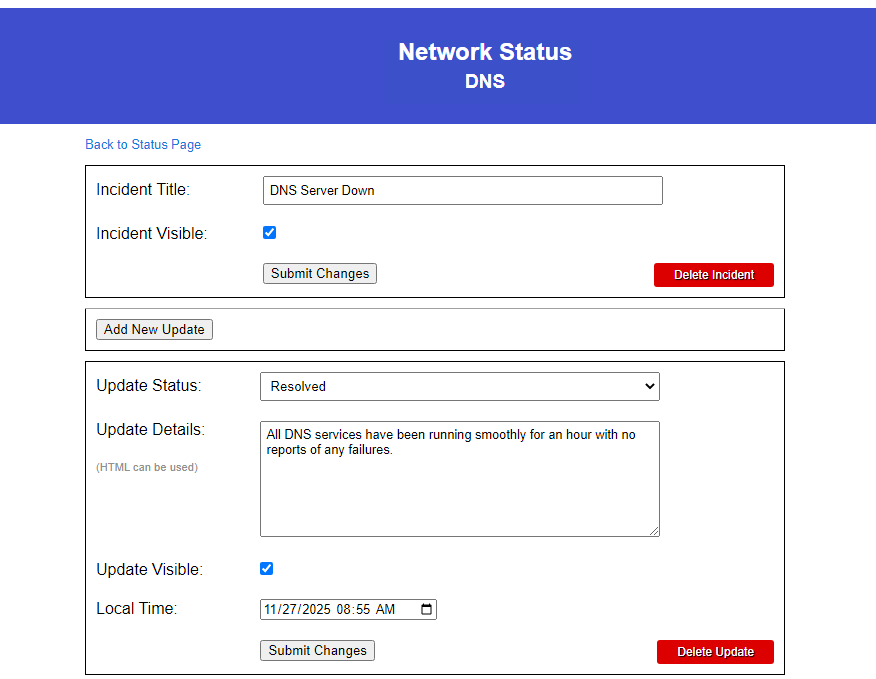
- Status - Select the current incident status:
- Investigating - Issue identified, investigating root cause
- Problem Identified - Cause has been determined
- Fixed and Monitoring - Issue resolved, monitoring for recurrence
- Resolved - Issue completely resolved
- Details - Provide detailed information about the incident. HTML formatting is supported. Include actions taken, impact description, etc.
- Visible - Control whether this update appears publicly.
- Local Time - Set the timestamp for this update. This defaults to the current time but allows backdating updates if needed.
Click Submit to save the incident and update.
As an incident progresses, add status updates to keep users informed. Navigate to the incident using the admin URL and click Edit Incident on the specific incident. Here you can add a new update, or edit
existing updates.
Incidents and Updates can also be deleted.
Troubleshooting
Status page not updating?
The status page is updated once per minute. When you save an edit to an incident or update, it should update the status page within a few seconds.
If you don't see the status you expect, check that the service has at least one active monitor, verify monitors are running and collecting data and that the database contains sufficient history.
Cannot create incidents?
Verify you have "Can Edit Status Incidents" permission, and that you are logged in.
URL not working?
Verify the HTTP/HTTPS port is accessible
Check that the URL Part doesn't contain invalid characters
Confirm the status page was saved successfully
Not enough historical data?
- Increase "Monitor Status History Days" in Settings > Database Settings > Database Cleanup.
- Wait for more data to accumulate
- Reduce the "Days of Status History" in the status page configuration