 We often get asked about suggested practices for monitoring servers and it’s a legitimate request – there are so many moving parts it’s hard to know where to start. There are two things you want your monitoring to do for you:
- Watch systems 24×7 and alert you if there is a problem
- Show you current and historical data (usually charts) to help you get a feel for overall health and future needs
ALL of the suggestions below are for the general case. There are definitely specific situations where one or more recommendations won’t apply (maybe high memory usage is desired on a database server for example), so consider your situation as you consider the recommendations.
Alerting
 For alerting, it’s a good idea to think of what issues are absolutely critical and must be handled now (corporate web site is down) vs things that need attention, but can wait a bit (disk space is under 10% free).
For critical alerts, email is a start, but probably not enough. You want a pager or phone to beep at someone to get their attention. SMS texts, iPhone push notifications, etc. would be a good idea.
Non-critical alerts can go to email. Sometimes emails get deleted or forgotten, so it’s a good idea to have some sort of reminder or event escalation (where alerts get sent higher up the chain of command the longer the issue is left unresolved).
Basic Monitoring
The core of most monitoring products is ping, CPU, memory, disk, and web pages, so we’ll start there.
Ping
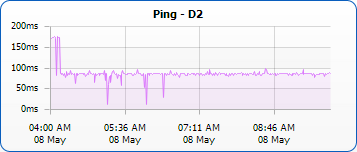 All of the rest of the monitoring isn’t worth much if the server or device isn’t up and running. Pinging fairly often (at least once a minute) helps you stay on top of problems as they happen. The trick is to not get hit with a lot of false-positives, which can easily happen on a busy network. So make sure you’re only alerted after a few pings in a row have failed.
Chart Setting: Show peak response times for the past 24 hours
CPU
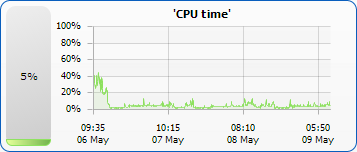 Monitor the CPU usage (normally a percentage of total possible CPU output). It’s normal for it to go up and down depending on the load. Having a very low average value means your server isn’t being utilized much, and that server might be a good candidate for virtualization. If the value is quite high (90%) for an extended period, the CPU might be a bottleneck. If it’s at 100% for very long at all, the system is probably not functioning well.
Chart Setting: Show average usage for the past 3 days to spot any unusual patterns
Memory
 Measuring memory can be tricky since there are so many definitions to consider. Total physical RAM in use? (you’d like to have 100% in use!). Total memory allocated (which can be greater than physical RAM)? Amount of allocated memory swapped out to disk?
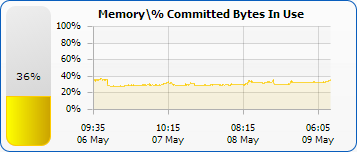
Personally, I like to know what percentage of memory in use out of how much is possibly available (ie RAM and swap/page file). On Windows, this is the Memory\% Committed Bytes in Use and is defined as:
“% Committed Bytes In Use is the ratio of Memory\Committed Bytes to the Memory\Commit Limit. Committed memory is the physical memory in use for which space has been reserved in the paging file should it need to be written to disk. The commit limit is determined by the size of the paging file. If the paging file is enlarged, the commit limit increases, and the ratio is reduced). This counter displays the current percentage value only; it is not an average.”
If the % of total memory is high, you might be swapping to disk a lot and thus getting lower server performance. You can check this by also monitoring how much of the swap/page file is in use.
Alert on swap/page file use > 70%
Chart Setting: Show 5-minute maximum for the past 3 days to spot any unusual patterns
Disk
I’ve experienced cases where an OS has crashed because there was no free disk space. Certainly databases, mail servers, etc. don’t function well when they can’t write their data to disk. Low disk space is a critical problem, but usually (hopefully) a slow moving one so you have time to fix it.
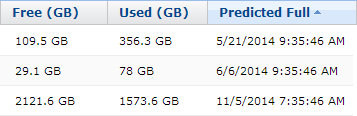 One useful feature to watch for is trend analysis where the monitoring product looks at disk growth rates and tries to predict when you’ll run out of disk space. This gives you an early heads up so you can be proactive rather than reactive.
Chart Settings: Because disk space normally changes slowly, chart 30 days so you can visually see trends
Web Page Performance
 If you or your company has a website, knowing the website is up is pretty darn important. A web page monitor should be able to check:
- Is it the site up?
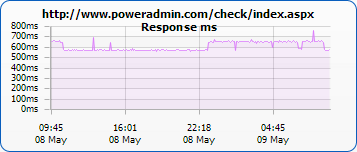
- Is it responding as quickly as expected?
- Are there any errors on the page?
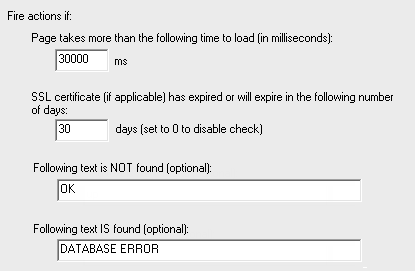
Some monitoring products can also check resources (ie file is where it should be), SSL certificate expiration, etc.
You’ll need to decide how important the website is. If it’s absolutely critical to your business, checking once every couple of minutes makes sense. If it’s a personal blog, maybe once an hour is OK.
 Hint: Since checking a page often could affect stats, have a separate page (maybe in a separate folder) used just for polling if you can. That way it’s easy to filter those requests out from the stats. Or if you need to hit the main page, consider adding something to the url like ?MONITOR=true for the same reason.
Hint 2: Some people want to check that the webserver is able to access the database. I recommend having one page that hits the database and then outputs “OK” or “DATABASE ERROR”. Then your web page monitor can check that page and alert if it sees “DATABASE ERROR”.
Chart Setting: Maximum response time over the past 24 hours
Advanced Monitoring
The next article in this series will explore some advanced monitoring scenarios, like watching Event Logs for specific events (user login for example), watching log files for errors, and more.
If you are looking for a product that can do all of the above, we just happen to know about a good one 🙂


Photo Credit: midom via Compfight cc
Photo Credit: One Way Stock via Compfight cc