
By Des Nnochiri
Reporting software is a part of a Business Intelligence or BI suite and is used for analysis in early data processing. The purpose of self-service reporting software is to help deliver interactive information that can be put into action. Self-service reporting software allows the user to connect data sources, extract data and present it in various formats of visualization, including charts, tables, and spreadsheets. These visualizations can then be used to create operational reports as dynamic web pages that can be shared and used interactively and exported into static, printable formats.
The uses of self-service reporting software are diverse. Data translated into actionable information is useful in analyzing performance and managing various types of data gathered from different sectors of business operation and administration, which in turn helps to promote better decision-making.
Microsoft Power BI
Many consider Microsoft Power BI to be top-of-the-range in terms of Business Intelligence suites. The suite is available as a limited free version and comes with 1GB of storage and a daily refresh cycle, as well as a Professional version priced at $9.99 per month per user with 10GB of storage and an hourly data refresh cycle.
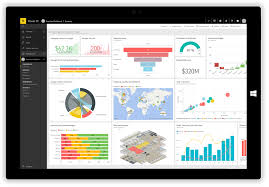
A highly-intuitive user interface makes the suite easy to use and will look familiar to most users. The combination of power analytics, outstanding data visualization tools, and expansive data connectivity makes it a powerful Business Intelligence suite to work with. The Power BI has an extensive number of data connectors, which enables users to connect third-party tools such as MailChimp and Salesforce to its database.
It should be noted that Microsoft Power BI may be more useful for data scientists working with enormous sets of data, as the tool requires the preparing of data before moving it onto the web user interface to publish, putting it beyond the capabilities of everyday users. If you are looking for extraordinary data visualizations and great connectivity and don’t mind using a data preparation tool separate from the user interface, Microsoft Power BI is a powerful tool indeed.
Google Analytics
One of the most popular self-service reporting tools, Google Analytics, is free to use and offers a wide range of tools for its users. It is the go-to solution for any business looking for a nifty mobile and web analytics tool. Google Analytics is probably most useful for those looking to use it for ecommerce and content marketing purposes. It can be used in finding out the path that the visitor took to get to your website, how they behave once on the site, and whether they are making purchases or leaving the shopping cart empty.
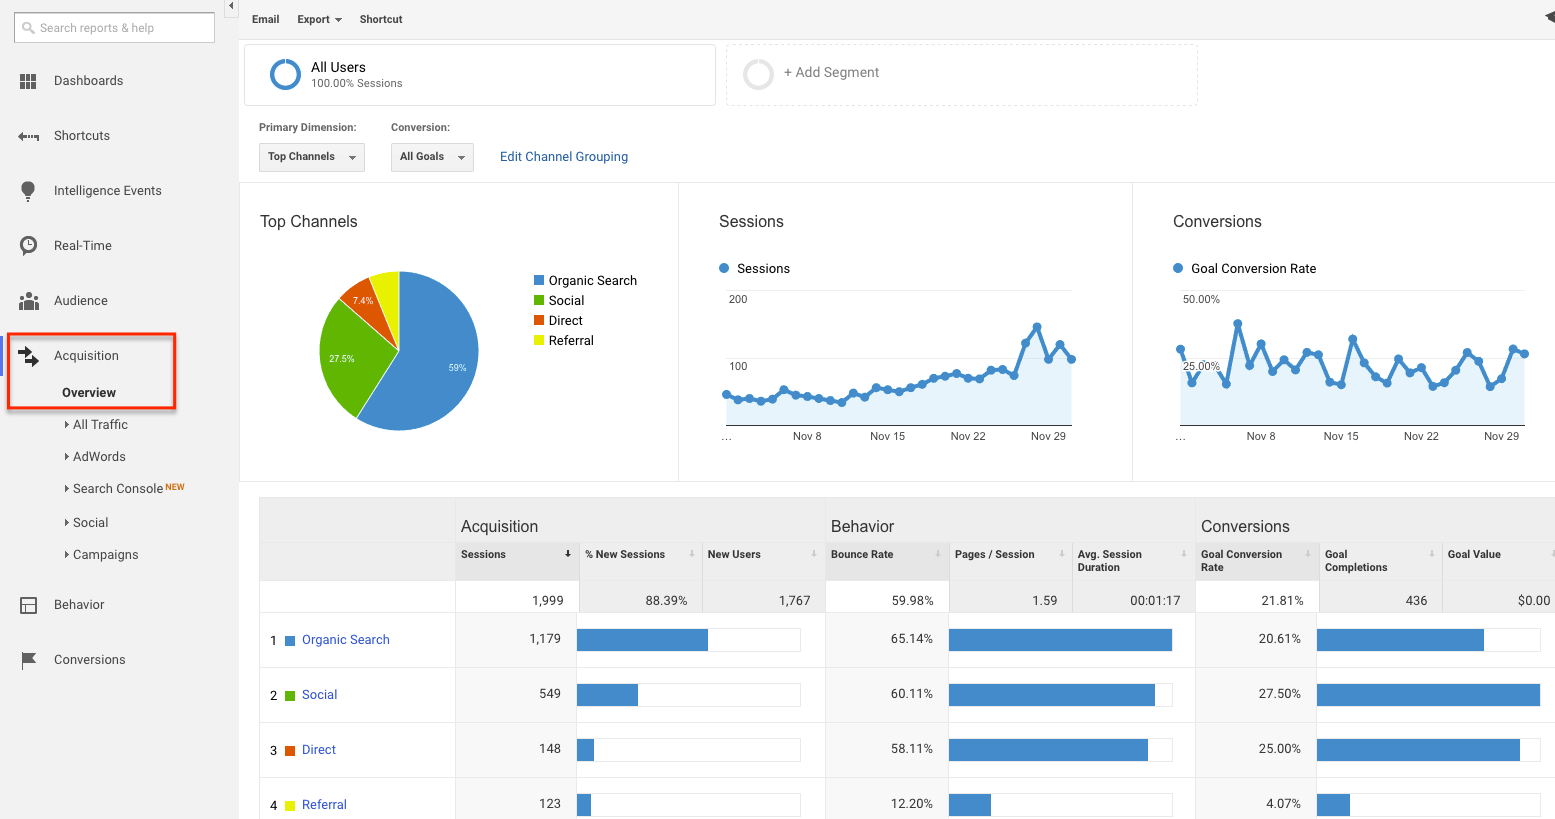
The premium version of Google Analytics offers a 24-hour or longer data refresh cycle, a lot of different visualization options, and connectors for Google AdWords, Google Sheets, and some other Google services. The popularity of Google Analytics among business users means that Microsoft Power BI and Tableau Desktop, two market leaders, offer a connection to Google Analytics. In other words, you can use Google Analytics in combination with other reporting tools to create visuals of a higher standard than what Google Analytics offers on its own.
Google Analytics does require quite a bit of self-study before it can be deployed to employees. Google doesn’t really meet in the middle when it comes to providing assistance in training, but luckily there are countless training videos on YouTube and LinkedIn, etc., that can be utilized. With a bit of investment in time, Google Analytics can really help your business bloom, so it is really something to consider when looking at your options in choosing the right self-service reporting tool.
Sisense
Sisense is a potential challenger to the household names out there. As the brand is making its name, the self-service reporting software package is priced by custom quote only. This should not create a barrier, however, as those in-the-know are aware of what Sisense is capable of.
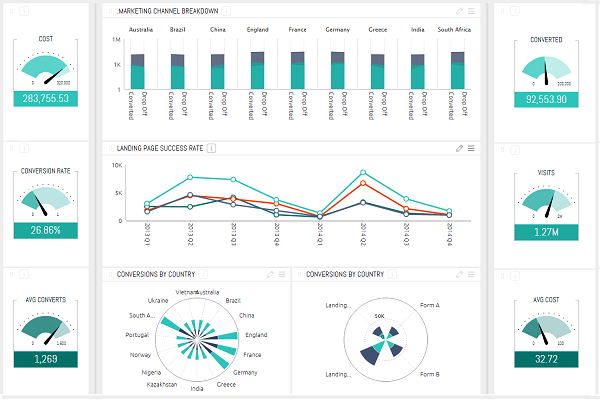
Providing extraordinary functionality such as in-chip processing (as opposed to in-memory processing), natural language commands that can be utilized in third-party applications such as Skype, and an outstanding depth of visualization, Sisense is definitely on the verge of a big breakthrough. Well-organized support with online training and a great blog are available for those looking to master the software, and the company is consistently working to make improvements.
An experienced analyst should find Sisense a breeze to work with, although it provides some interesting features that challenge even the most prestigious products on the market. Its intuitive user interface makes it easy to use for those familiar with analytics tools. Sisense works well with other analytics solutions and apps, and it can pull data from various sources, including eBay, Facebook, QuickBooks, and PayPal, which makes it great to use in ecommerce. The strongest selling point of Sisense seems to be its visualizations, which can help analysts discover more than they expected.