By Zoë Dunning
Continuing with last week’s article on Current and Average Disk Queue Length, this week we’ll discuss Pages Per Second and its related counters.
Overview
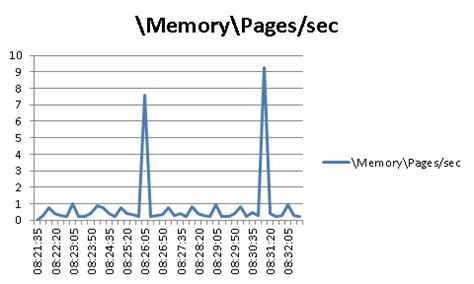
Just as you should monitor the number of requests that Current and Avg. Disk Queue Length represent in the queue to pinpoint possible bottleneck, you should also keep an eye on the Pages Per Second counter to determine whether you are at risk of the memory system becoming limited or diminished.
“\Memory\Pages/sec” is based on the combined input and output of pages, also referred to as the “\Memory\Pages Input/sec” and “\Memory\Pages Output/sec” counters. Pages Input/sec is the total number of pages read from the disk, and Pages Output/sec represents the total number of pages removed from memory and traveling toward the disk. My Pages Output/sec is so low that it doesn’t show on the graph below, being flatlined.
Pink= Pages Input/sec; Blue= Pages Output/sec
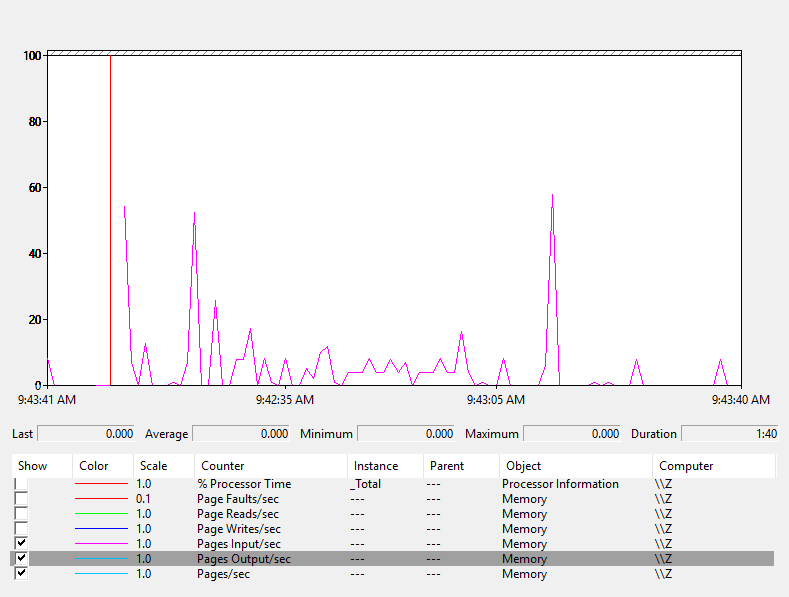
Closely related to Pages/sec are the “\Memory\Page Reads/sec” and “\Memory\Page Writes/sec” counters, as they show how much the disk is affected by paging operations. Page Reads/sec is the rate at which the disk is read to resolve page faults. Page Writes/sec is the rate at which page data is written to the disk to open up space in physical memory.
Green= Page Reads/sec; Yellow= Page Writes/sec
Potential Problems
Memory is frequently the root cause of performance problems. Thus, you should rule out memory problems accordingly before examining other system areas for potential sources.
The lower the memory system’s paging values, the better. Even if they spike occasionally, you have no cause for concern if they soon return to the same values (or approximations). However, if your Pages Input/sec counter shows a value of 20 or greater for a slow disk, you should closely monitor it. A faster disk should be able to process more. If your Pages/sec counter consistently shows more than 40 pages per second on a slow disk or 300 pages per second on a fast disk, you should investigate. Your system memory is—in all likelihood—too small for the processing load.
Page faults are one of the most common memory-related bottleneck issues encountered with paging operations that can be monitored by Pages/sec and its associated memory counters. A page fault results when a process requests a page in memory, but the system can’t recover it from the requested location. The page fault is placed in a “wait” state while the operating system attempts to restore that page to physical memory. If the requested page is still in memory but perhaps in the wrong process, this is a soft fault. On the other hand, if the page must be retrieved from the disk, this is a hard fault. Most processors can manage soft faults, but hard faults can instigate substantial delays.
The “\Memory\Page faults/sec” counter, shown below, monitors the rate at which the processor handles both soft and hard faults. As you can see, my rate of page faults is skyrocketing. If my Page reads/sec were also high, that would be a strong indicator of insufficient RAM.
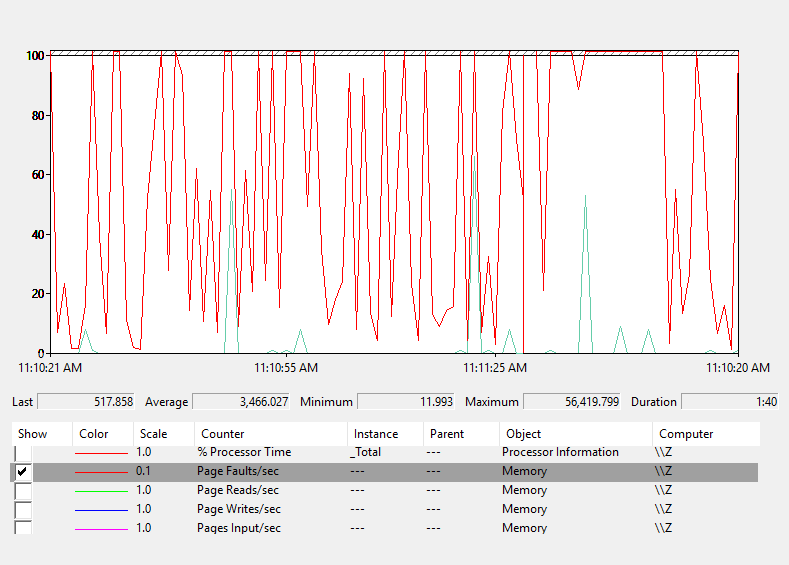
Red= Page Faults/sec; Green= Pages/sec
Troubleshooting
If your Pages Input/sec counter shows a value of 20 or greater for a slow disk and/or your Pages/sec counter consistently shows more than 40 pages per second on a slow disk or 300 per second on a fast disk, you can solve this issue simply by adding more memory to your server.
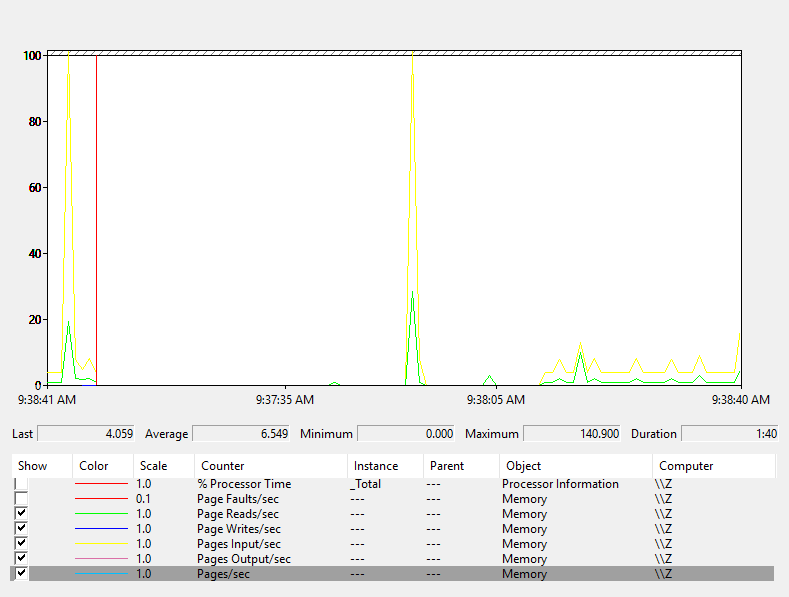
To discover whether or not you’re experiencing hard page faults, compare your values of Pages Input/sec and Page Reads/sec to determine the average number of pages read into memory during every operation. Pages Input/sec will be greater than or equal to Page Reads/sec if you have hard faults (see below). A large quantity of hard page faults could signify that you need to increase the amount of memory or reduce the cache size on the server.
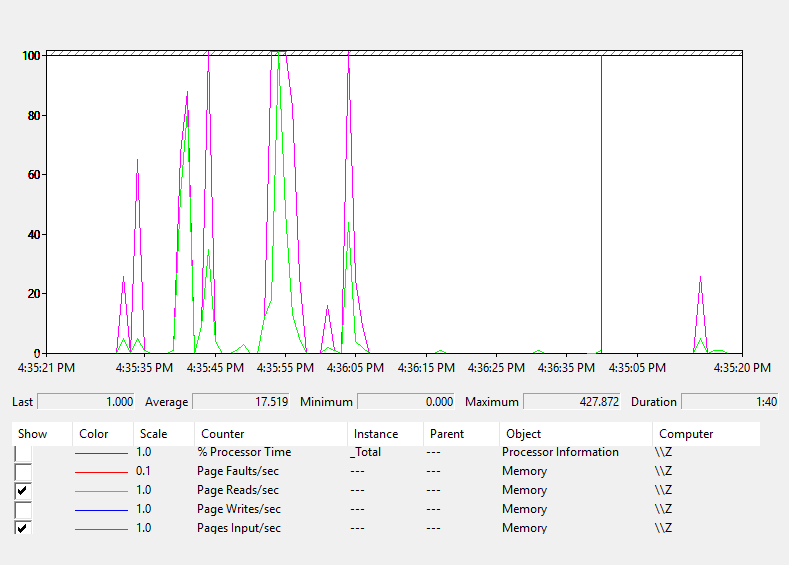
Green= Page Reads/sec; Pink= Pages Input/sec
Conclusion
“\Memory\Pages/sec” is the sum of “\Memory\Pages Input/sec” and “\Memory\Pages Output/sec”. Pages Input/sec is the total number of pages read from the disk, and Pages Output/sec is the total number of pages sent to disk from memory. “\Memory\Page Reads/sec” and “\Memory\Page Writes/sec” show how much the disk is affected by paging operations based on the rate that pages that are read and written to the disk. “\Memory\Page faults/sec” is the rate at which the processor handles both soft and hard faults.
Memory is usually the source of performance problems, so check it first before another system area. The lower the memory system’s paging values, the better. If your Pages Input/sec and Pages/sec counters show irregularly high values consistently, you can resolve the issue by adding more memory to your server.
Page faults—when a process requests a page in memory, but the system can’t recover it—can be soft or hard, but you mainly have to worry about hard faults. Pages Input/sec will be greater than or equal to Page Reads/sec if you have hard faults. For this problem, the solution is to increase the server’s memory or reduce the cache size. Finally, if your Page Faults/sec and Page Reads/sec are both high, you could have insufficient RAM.