With so many people working from home now, Terminal Servers and Remote Desktop Gateways are surely getting exercised like never before. Perhaps you want to monitor them to see how busy they are, and alert if there are problems. Below are a few ideas.
CPU of Course
Naturally you need to monitor the server’s CPU usage. Do this with the following counter:
Processor\% Processor Time
There are many other counters that can be watched as well, but this one is the one to start with.
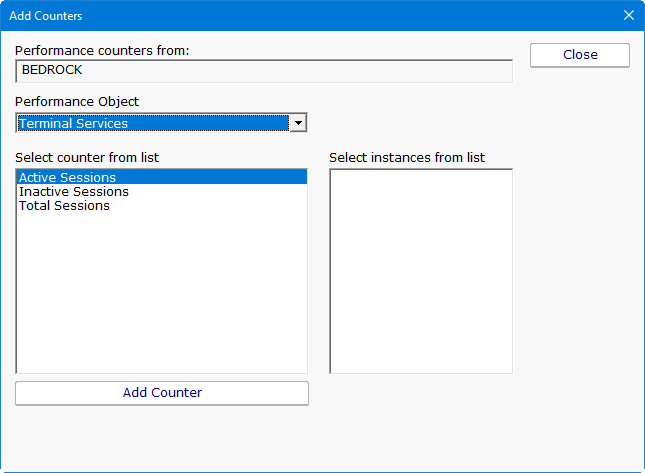
Terminal Servers
The Terminal Server software comes with a set of its own counters. You probably want to chart the value for
Terminal Services\Active Sessions
to see how busy your servers get. Monitoring, alerting and charting these performance counters is easy to do with the Performance Monitor in PA Server Monitor.
Remote Desktop Gateway
The counters for Remote Desktop Gateway are found in the Terminal Services Gateway performance object. Here too you should chart the number of active connections to get an idea of server load using the following counter:
Terminal Services Gateway\Current connections
Performance Monitoring
Microsoft has a great article about monitoring RDP performance and how the user is perceiving the interaction with their applications. They use the User Input Delay per Session performance object. You can read more here:

If you haven’t seen how easy it is to monitor performance counters, Windows services, temperatures and more with PA Server Monitor, you should take a look! You’ll be pleasantly surprised.