By Zoë Dunning
This week’s topic is monitoring CPU usage using the “\Processor Information(_Total)\% Processor Time” and “\Processor Information(_Total)\% Processor Queue Length” counters.
Overview
“\Processor Information(_Total)\% Processor Time” shows the percentage of the time that the processor takes to execute a non-idle thread during a sample interval. In other words, this counter shows processor activity. % Processor Time is calculated by subtracting the percentage of time to execute an idle thread from 100%.
“\System\% Processor Queue Length” corresponds to the number of threads waiting to be processed by any CPU (as opposed to Server Work Queue Length, which measures the threads waiting to be processed by a particular CPU).
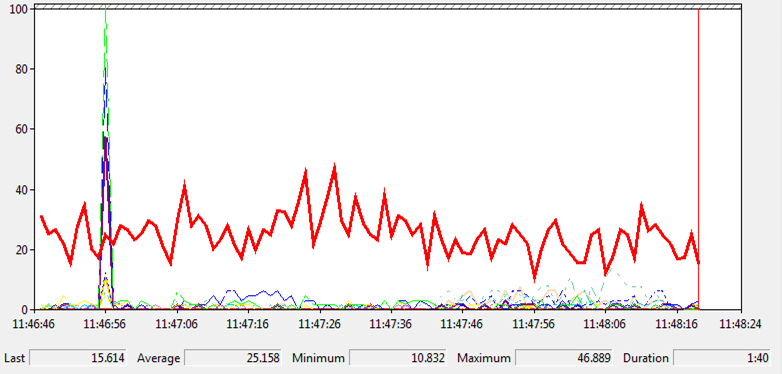
Dark blue= % Processor Time; Light blue= % Processor Queue Length
Potential Problems
Similar to the issues encountered with Current and Average Disk Queue Length, the processor—like the disk queue and memory—can become bottlenecked. A processor bottleneck occurs when threads require more processor time than is available.
% Processor Time won’t necessarily be high if % Processor Queue Length is high. A consistently high rate of CPU usage for % Processor Time—in the range of 80% to 90%—could be a problem. Monitor each % Processor Time counter for each individual processor if you have a multiprocessor system.
However, if you have a SQL server that executes numerous calculations, 100% of the processor’s time can be used without a bottleneck occurring. However, monitor this closely to catch if the performance of other applications and functions begin to suffer.
Troubleshooting
If you notice a steadily high rate of CPU usage in the 80% to 90% range, you may need to upgrade your CPU. Install a faster processor if you have more than a couple of processes simultaneously trying to use processor time, resulting in a bottleneck. If you have a multiprocessor system, you can also add more processors.
Conclusion
“\Processor Information(_Total)\% Processor Time” shows processor activity by displaying the percentage of the time that the processor takes to execute a non-idle thread. “\System\% Processor Queue Length” corresponds to the number of threads waiting to be processed by any CPU.
To avoid processor bottleneck, monitor your % Processor Time counter for unusually high rates of CPU usage. Typically, 80% to 90% of CPU usage is problematic unless you have a SQL server that can manage multiple calculations simultaneously. In that case, 100% of the processor time should be able to be used.
If you notice a steadily high rate of CPU usage in the 80% to 90% range, you may need to upgrade your CPU by installing a faster processor or adding a new one if you have a multiprocessor system.