- Solutions
-
- File Server: Ransomware Protection
- File Server: File Copy
- File Server: Audit File Access
- File Server: Storage growth reporting
- Licensing/Pricing
- Contact
This help page is for version 5.6. The latest available help is for version 9.4.
The Server Temperature Monitor works with the free SpeedFan computer temperature measuring program. You need to download it from http://www.almico.com/speedfan.php and install it (it can be downloaded and installed in under a minute).
NOTE: Because SpeedFan interacts with and probes very low-level hardware, the SpeedFan website suggests caution when first running it in case there are any issues. Running it on test hardware is recommended.
After SpeedFan is installed, the Server Temperature Monitor will query the SpeedFan app to extract current temperature values from the various temperature probes detected.
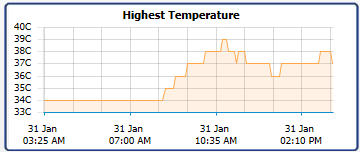
Server reports will soon show a temperature graph charting the highest measured temperature:
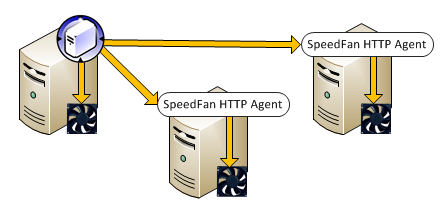
The Server Temperature Monitor can automatically connect to SpeedFan that is installed on the same computer as the PA Server Monitor software. To retrieve temperatures from SpeedFan running on other computers on the network, you'll need to install the free SpeedFan HTTP Agent which makes the temperature data available on the network as shown below:
To configure the Server Temperature Monitor:

After a connection to SpeedFan has been established, live temperatures will then be collected and displayed.
Default temperature thresholds are shown to the right of the live temperatures. Simply click a temperature threshold and change it to whatever value you like.
Like all monitors, this monitor has standard buttons on the right for Adding Actions, setting Advanced Options and setting the Monitor Schedule.

The various temperature values are all recorded to a database. You can run reports that chart these values or produce tabular output in HTML or .CSV files for importing into Excel, etc. The data can be optionally summarized into hourly, daily, weekly and monthly values.