Web Page Monitor
This is the most flexible and powerful Web Page monitor out there :)
The Web Page Monitor lets you define one or more web pages or web resources that should be checked. You can check return codes, data size,
content on the page and/or changes in content size.
Data about load times are stored for charting and reporting.
One or more pages can be checked by each monitor. If any pages are not OK, the monitor will fire actions. You can also create multiple Web Page monitors to check
different pages, or alert differently.
Individual Settings (Request Tab)
A number of parameters can be given to control what and how the web page is monitored. When you first create the monitor, you will see
this first dialog.
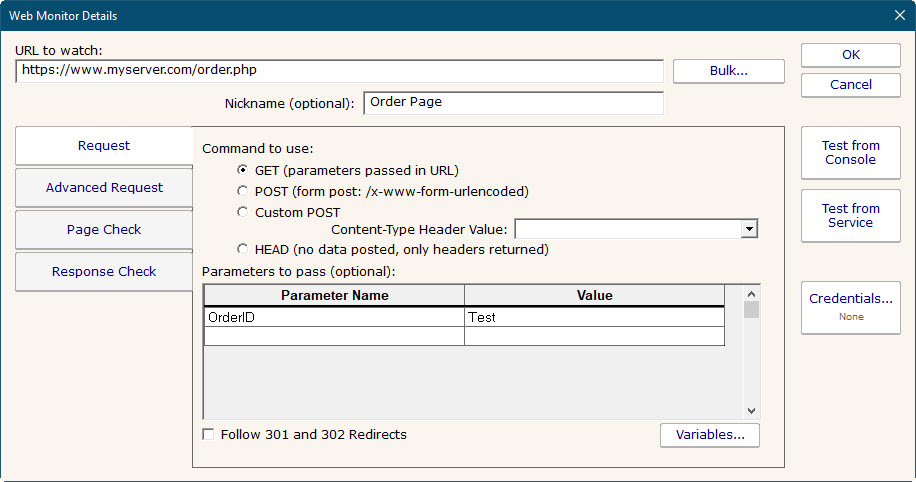
- URL to watch
- The URL for the page is specified at the top. The protocol (http:// or https:// for example) should be included in the URL. Additional parameters
can be passed in the URL if desired. For example:
http://www.myserver.com/pages/check.php?page=1&val=test
In addition, parameters can also be passed via the Parameters section below, which is especially useful if you want to POST data to a page.
- Nickname (optional)
- Reports will use the Nickname if available, otherwise the URL will be shown.
- GET/POST/HEAD
- Specify whether the URL should be called with an HTTP GET, POST or HEAD command. If fields and values are specified, they will be appended to the URL for a GET, or POSTed as a form post. If POST is used, the
URL is not changed (even if you appended variables in the URL field at the top).
HEAD doesn't request the body of the page, so you can't check the content. However, it is a good light weight command for checking error codes, SSL certificate expiration, etc. And it
usually doesn't count as a page hit if you don't want to affect page stats.
- Parameters to pass
- Here you can give field names and values for those fields. These values will be appended to the URL for a GET, or sent as a form post for a POST. The data will be UTF-8 encoded before sending.
- Variables
- Variables are values that are replaced when the monitor is run. They can appear in the parameter name or value, and also in the URL. For example:
http://www.test.com/getpage.aspx?randomID=$CACHEBUSTER$
$CACHEBUSTER$ will be replaced when the HTTP request is made with a unique value each time the monitor runs.
- Follow Redirects
- If an HTTP redirect status code (301, 302, etc) is returned, it will be followed if this flag is checked. The followed page will then be checked for Success Text, Error Text, etc.
Advanced Request Tab

- Headers
- If you have a server that hosts many web sites, you probably need to set the SERVER header so the web server can differentiate which site to send the request to. Any headers
can be added here, and they can use variables just like the GET/POST parameters can.
- Enable Cookies
- Cookies can be recorded and then used on subsequent requests if this is checked. This could be useful for pages that allocate new IDs (visitor IDs for example) or other values/resources for each new visitor.
- Proxy Server
- If the page must be retrieved through a specific proxy server, that proxy can be given in this field.
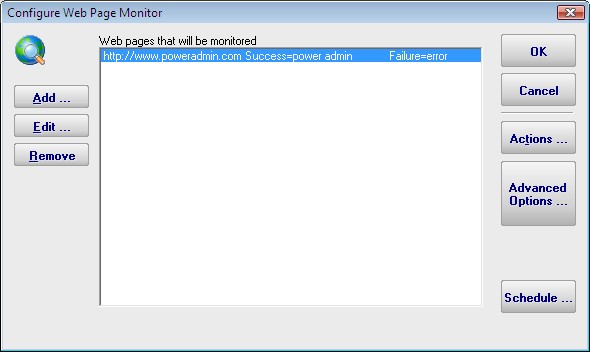
Page Check Tab (when to alert)

- Success Text
- If this value is given, the retrieved page will be searched. If the Success Text is not found, the monitor will fire alert actions.
- Failure Text
- If this value is given, the retrieved page is scanned. If this text is seen, the monitor fires alert actions.
- Page Content Changes
- If checked, the monitor will compare the retrieved page to the previously retrieved page and look for differences. If a difference is found, the monitor will fire alerts.
- Append Page Content
- If alert actions are fired, this check box indicates the retrieved page HTML should be appended to the alert. This often helps when troubleshooting a problem.
- Try Again
- If the page fails to load, or the target values can't be found, the monitor can make an additional try to load the page and will check again when this value is checked.
Response Check (when to alert)

- Page Load ms
- The page load time is compared against this value. If load time is greater than this value, alerts are fired.
- SSL Certificate Expiration
- If you check an HTTPS URL, the certificate's expiration date will be checked. If it will expire within the specified number of days, an alert is fired. You can set this value to 0
to ignore certificate expiration errors. If HTTPS is not used (ie, just HTTP), then this setting is ignored.
- Response Code
- The HTTP Response Code will be checked, and if it matches the value given, alerts will be fired. This is a good way to check a non-text resource, such as
verifying a particular graphic or download file is accessible. This can be used with the HEAD request type to avoid actually downloading the target object.
- Data Size Changes
- Alert if the size of the requested page/item changes. This works with the HEAD command so you can verify that a target file is available and the correct size.
Script Checks
By clicking the dropdown part of the Add button, you can add a Powershell script that will be run immediately after the web page is fetched. The script
contains variables that will let it access content, status values, etc of the downloaded page. This gives the monitor richer possibilities for when
to alert, and the details that can be included in the alert.

The default script contains more information about the available values and how to use them.
Testing
There are two test buttons. "Test from Console" will make the web page request from the Console that you are using. "Test from Service" will send the URL and parameters to the Central Monitoring Service
(which may or may not be on the same computer as the Console) and make the request from there. This tests the page request in a production setting.
If you are using the Data Size Changes or Page Content Changes settings, the page will be requested twice, with approximately a 5 second pause between requests, and then the two requests will be compared.
During production runs, the size and content will be retrieved and compared to the values saved during the previous monitor run.
After running the test, you will see something similar to this:

Standard Configuration Options
Like all monitors, this monitor has standard buttons on the right for Adding Actions,
setting Advanced Options and setting the Monitor Schedule.
Supported Reports
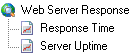
The Web Page monitor can create reports based on the page response time for the target URL. This data can be charted as well as output
in .CSV or HTML tabular form. In addition, you can define what 'up' means and create an uptime report showing a percentage of uptime
over a given time period.