This help page is for version 3.8. The latest available help is for version 9.4.
Server Status Report
The Server Status Report is a quick way to check basic stats on your server.
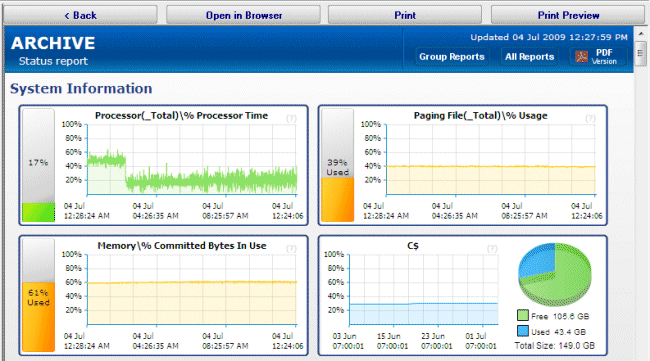
At the top right of the report are buttons to show you the reports for the group the server is part of, the index of all reports, and a button to get a PDF version of the report.

In the System Information area are some optional graphs. The graphs will probably be different than the ones shown above. The graphs are automatically created based on data collected by the running monitors.

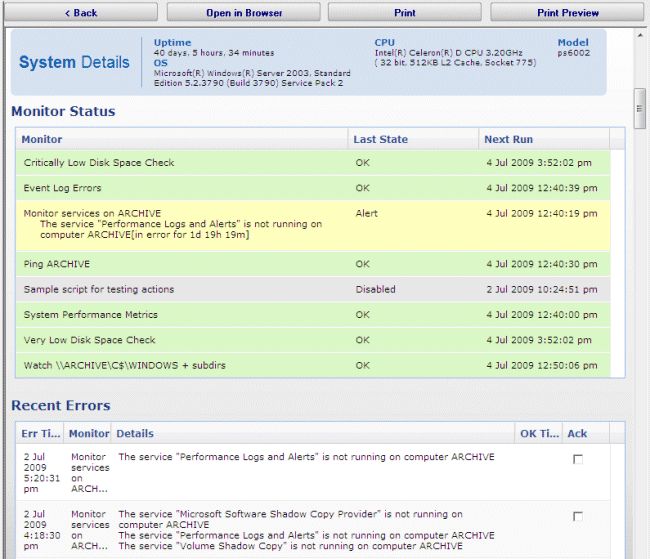
When you scroll down past the charts, there maybe a System Details section. The data for System Details is collected via WMI on Windows servers. If that section is missing, look at the very bottom of the report for WMI hints..
The next section is Monitor Status. All monitors on the server are shown here, along with the most recent status and the next run time for the monitor. If you want to see the Last Run Time, right-click on the monitor in the navigation panel on the left side of the application.
The Recent Errors section shows alerts that have recently been fired. On the right side is an optional columns labeled Ack, short for Acknowledge. The Ack column is part of the Error Auditing system. You can hide or show the column and make other adjustments to the Error Auditing settings by right-clicking the computer and going to Report & Delivery Settings -> Report Settings.
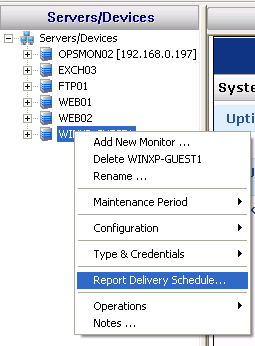
If you are using a Pro or Lite license, you can also schedule the status reports to be emailed to you. Simply right-click on the server and choose Report Delivery Schedule.

Adding Additional Charts
You can add additional charts from data that a Performance monitor is collecting. Open Regedit and go to:
HKEY_LOCAL_MACHINE/software/PowerAdminServerMonitor
At this location is a value named StatusReport_Match_OtherPerf. When charts are built for a server, the performance counters are compared to the value of this registry setting. If the text in the registry setting is found in the counter, the chart is created.
For example, if the setting said "Browser\Announcements", then the counter
"\\{server}\Browser\Announcements Total/sec"
would match.
You can add multiple counter items separated by a comma:
\% Disk Read Time,\% Disk Write Time (no extra spaces around the comma!)
Finally, this is a global setting and will add the specified extra chart to any server that is collecting data on a matching performance counter.

