- Solutions
-
- File Server: Ransomware Protection
- File Server: File Copy
- File Server: Audit File Access
- File Server: Storage growth reporting
- Licensing/Pricing
- Contact
This help page is for version 8.2. The latest available help is for version 9.4.
The SNMP Monitor works as an SNMP Manager--it can query local or remote SNMP agents for specific values, and then compare those values to thresholds. If the thresholds are passed, actions are fired. In addition, the retrieved values are also stored in the database for creating reports.
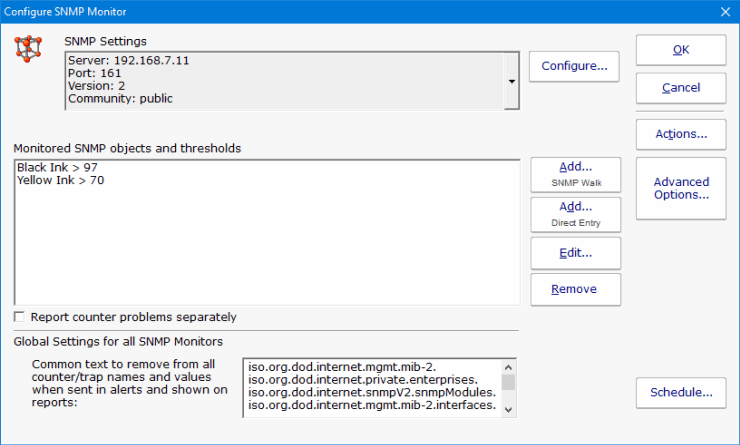
Configuring the SNMP Monitor requires SNMP credentials to be set, and specific SNMP objects and thresholds to be selected.
The default SNMP credentials are set to use v2c with community string set to 'public'. That will work in many cases, but you might need to make changes depending on your environment. The current settings are shown in the dialog above near the top, and pressing the Configure button will let you change those settings. You can also right-click the computer/device in the Console and choose Type & Credentials -> Set SNMP Settings.
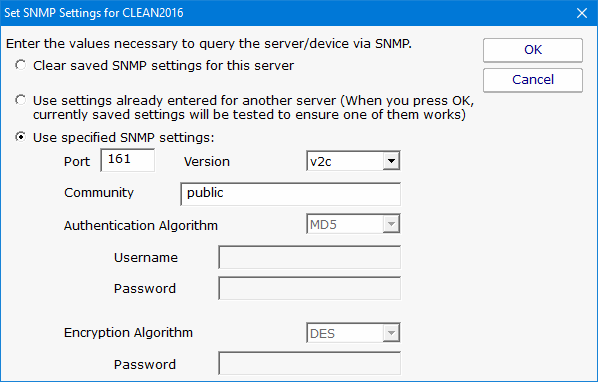
This dialog allows you to set the following items:
Once you have entered the information that will allow access to your SNMP agent, press OK in the "Set SNMP Settings" dialog to save the SNMP server settings and to return to the Configure SNMP Monitor dialog.
Monitoring a Linux server?
By default, Linux restricts SNMP access to queries from the local computer only. To enable network access, you'll need to edit:
/etc/snmp/snmpd.conf
Look for a line about agentAddress. It might look similar to the following:
agentAddress udp:127.0.0.1:161
The above line might be commented out, or might not be in your file (not all snmpd.conf files are formatted the same). Instruct the SNMP daemon to respond to requests from the network is what is needed. Using the format from above, that line should look like this:
agentAddress udp:161
In addition, the default snmpd.conf file also restricts what you are able to see via SNMP. This is done by limiting which branches in the OID tree you can see. To enable more access, look for 'view' lines and add a line like the following:
view systemonly included .1.3.6.1
After making these changes, you will need to restart the SNMP daemon (how you do that depends on your distribution of Linux)
Thank you to Timothy Stokes for researching and sharing this information.
From the Configure SNMP Monitor dialog, press the Add button. That will display the dialog shown below. The SNMP monitor will query the remote agent and show you a list of all SNMP objects available from the agent. Those objects are also displayed using information from default MIBs that are on your system. If you have additional MIB files for objects that you want to view, press Load MIB button to select the MIB file. The display will update to include information from the newly loaded MIB file.
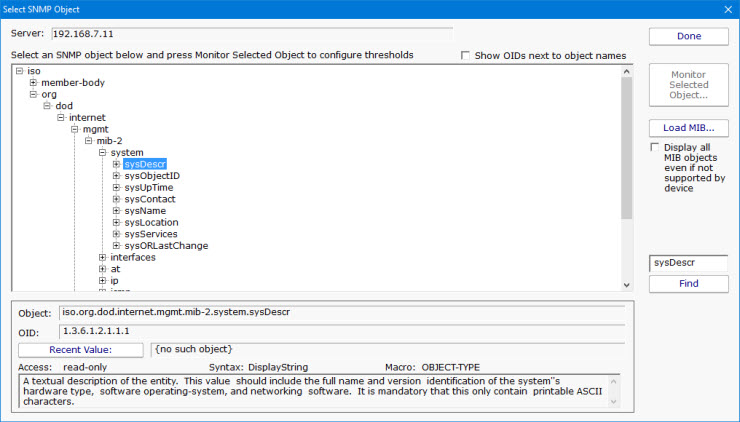
Note: If the target server is monitored by a Satellite, the available SNMP objects will be retrieved from the Satellite during the configuration step.
To monitor network bandwidth usage on a router or server, use the Find button to look for "ifInOctets" and "ifOutOctets" objects.
Unlike many SNMP browsers that only show objects for which you have MIBs loaded, this SNMP browser shows all objects that are available on the remote machine. Loading MIBs will add additional detail (like symbolic object names instead of just the numeric OID, and also textual descriptions for the fields).
As you move through the SNMP object tree, you'll see that the information at the bottom of the dialog changes. This bottom part of the dialog gives you information about each object according to any applicable MIB that was loaded. In addition, you can press the Recent Value button to see what the value is at that moment. You can navigate to the object that you're interested in, or use the Find button to find an object. The Find button will search for OIDs, object names and object values. You can press the Find button again after a search to keep searching further for the same value.
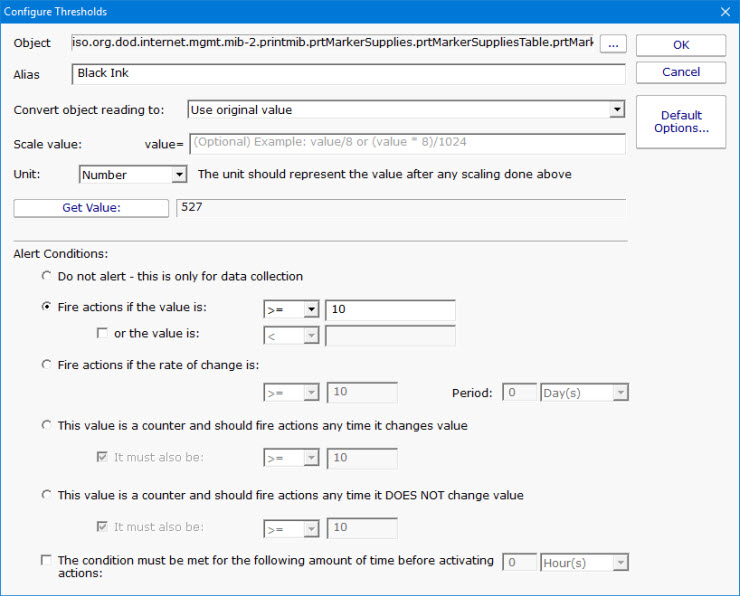
Once your target object has been found, press the Monitor Selected Object button. This will show you a small dialog where you can configure the thresholds for the value of that object. Once the threshold is set, you're brought back to the previous dialog so you can continue selecting addtional objects to monitor. When you're finished, press the Done button to return to the main SNMP Monitor configuration dialog.
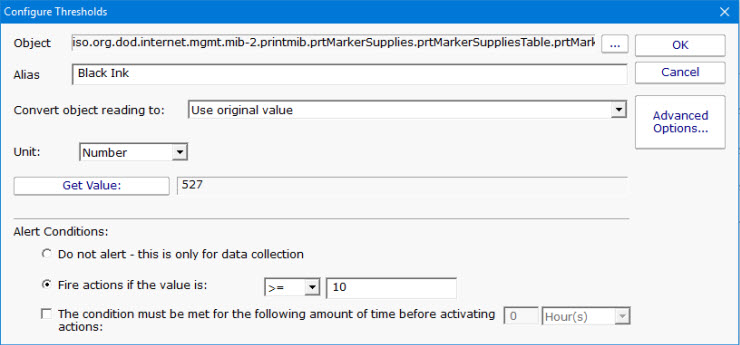
If you choose the Advanced Options button, the dialog changes and you are given richer threshold options, which include rate of change, checking for values within a range, or not alerting at all and just collecting data.
Each time a performance counter is measured and checked, it is also recorded in a database in order to generate historical reports.
For the charting to work correctly, it's important to specify the correct unit of the counter. The monitor will correctly correctly guess the unit for some common counters, but you will need to set it for others.
If the counter value cannot be represented by an existing unit, you might be able to scale it. For example, imagine the counter is MBps, but the available unit is Mbps. To correctly record the value, you should set the scale to:
and then set the unit to Mbps
As mentioned above, MIB files are not required to monitor, but they make it easier to understand and find the different nodes available. You can load MIBs into the system by clicking the "Load MIB..." button shown above. In addition, one or MIB files can be copied into the following folder on the Central Monitoring Service:
C:\Program Files\PA Server Monitor\MIBs
Every few minutes, MIBs copied to that folder will get loaded and parsed, and shared among Consoles or Satellites that don't have them.
Near the bottom of the dialog, you'll see this area where common SNMP removal text is shown:
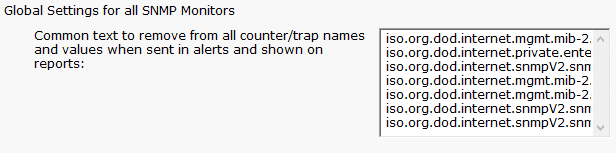
Removal text is shared among all SNMP monitors and Actions. Any time an SNMP object is reported on, the removal text is removed from the SNMP object's name. This helps cut down on clutter and makes reading the SNMP object names much easier.
Like all monitors, this monitor has standard buttons on the right for Adding Actions, setting Advanced Options and setting the Monitor Schedule.
The SNMP monitor can create charts from any of the counter values that are being monitored. This includes bar and line charts. Tabular HTML and .CSV output for importing into other apps (Excel) are also possible.
If you can't connect to a server/device via SNMP, make sure to double check the SNMP settings (version and community string in particular). Windows servers by default don't enable 'public' as a community string, and they don't accept SNMP requests from the network by default. These can both be changed by going to the SNMP server (in the Administrator Tools > Services applet), to the Security tab.