- Solutions
-
- File Server: Ransomware Protection
- File Server: File Copy
- File Server: Audit File Access
- File Server: Storage growth reporting
- Licensing/Pricing
- Contact
This help page is for version 8.1. The latest available help is for version 9.4.
Service Level Agreements (SLAs) and regulatory compliance with GLBA, HIPPA, PCI and SOX among other standards often requires auditing errors that occur on servers and devices. In addition, many IT organizations choose to use error auditing to ensure a high quality of service to the rest of the business.
Even if you don't have compliance requirements, the Error Audit report can be a good way to get a quick summary of a certain type of error that is occurring. See Not Just For Auditing below if this is you.
PA Server Monitor, PA Storage Monitor and PA File Sight all have Error Auditing built-in to the product. Auditing can be enabled or disabled, and used however it works best for your organization.
There are three parts to Error Auditing:
The products have always monitored resources, fired alerts when over thresholds and recorded resource values in the database for later reporting and charting. In addition, the different monitors would change color based on whether everything was OK (green) or alerts were fired (yellow). Red (internal or serious error) and grey (disabled or maintenance) are also possible colors.
When a monitor turns yellow, the yellow color shows up on summary screens for the whole server indicating that there is an alert on a monitor on that server. The server will show green when all monitors are green.
Some problems are transitory (a new event in the Event Log, a change to a file, etc). Alerts would be fired, but the monitor wouldn't stay yellow since on the next run everything looked OK, so it would go back to green (OK). If the administrator was not watching the server closely, that yellow alert status could come and go without being seen. A new option that can be set on a per-server level is to force monitors to remain yellow while they have unacknowledged alerts. This is available by right-clicking the server and going to Report & Delivery Settings -> Report Settings. Then double click on the Recent Alerts in the Displayed Report Items column.
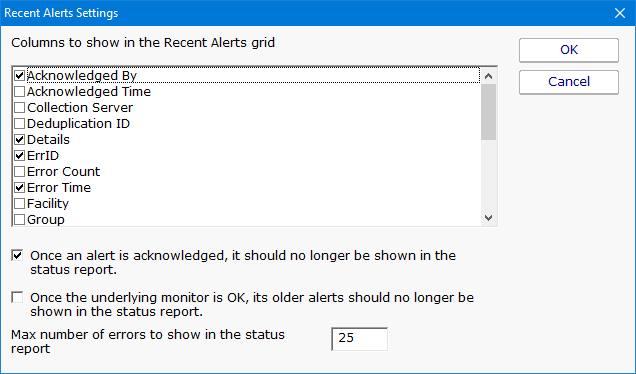
Additional options in this dialog control what is displayed in the Recent Errors section at the bottom of the server status report
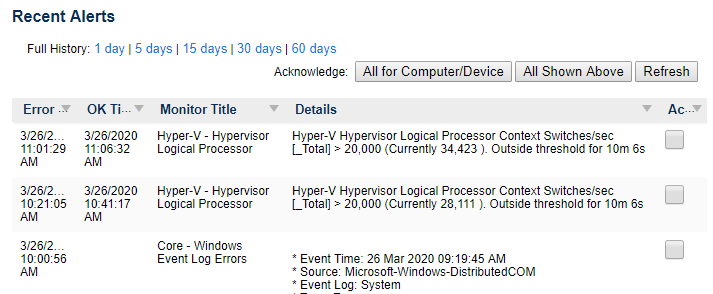
The next piece of the auditing system is the server administrators. At the bottom of the server status report is the Recent Alerts section. This shows issues that the monitors have recently discovered. What is shown there depends on the Report Settings dialog discussed above. Most often, there will be an Ack column.
When the Ack column is clicked, a request is sent to the service indicating that the error has been acknowledged. The acknowledgement time as well as the IP address of the user is recorded. [A future version will user logins to view reports -- at that time the username will be recorded instead of the IP address]. If an administrator accidentally acknowledges an error, they can click the Ack box again to clear the acknowledgement.
There are additional methods to acknowledge alerts.
Administrators will often not want to see the error again once they've acknowledged it. This can be controlled via the Report Settings dialog mentioned above.
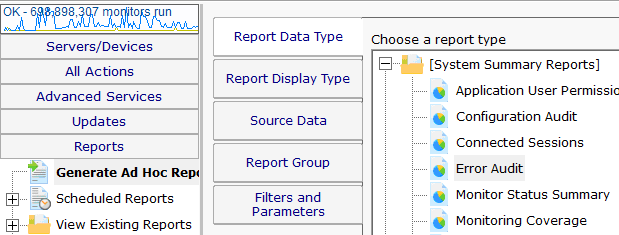
The Error Audit report is available under the [System Summary Reports] section.
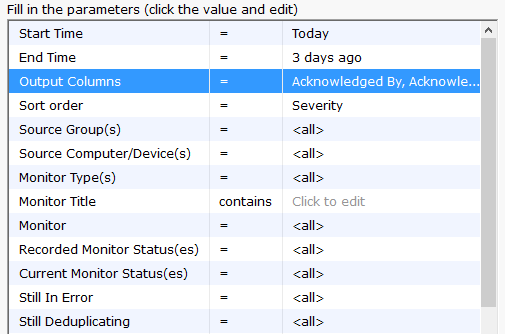
Once you've selected the report, go to the Filters and Parameters tab. This is where you specify exactly what you want to look at. There are a variety of different ways to filter the errors that you want to see. If your primary responsibility is disk space, just look at the Disk Space monitors under Monitor Type(s). If you have grouped the servers by geographic region, you could specify you only want to see errors in the Northern Europe Source Group for example.
More information about the Error Audit Report
There is a lot of data available and it might seem a little overwhelming at first. We recommend using the Output Columns filter and only show the data that you're interested in. You can see when a problem happened, when it was fixed, when it was acknowledged, what computer/devices it was on, etc.
Once you user the report a few times and have decided what you want to watch, we recommend creating a Scheduled Report. That way the report that you want will always be available (Scheduled Reports always use the same URL, so you can save it in your favorites and quickly see the latest report.
Large organizations often have multiple people that are responsible for different parts of the IT infrastructure. Creating Error Audit reports is a good way to view all errors that are happening to a group of servers, or to a class of resources (ie errors related to Ping response for example).
We recommended that each person with a large responsibility have their own Error Audit report so they can quickly see all errors within their area of responsibility. Errors can even be acknowledged on the Error Audit report itself, just like on the server status reports.
Create a scheduled Error Audit report for different team members that have responsibility for different areas of your network. They can save the URL in their browser's Favorites and quickly check and see if anything needs to be done.