- Solutions
-
- File Server: Ransomware Protection
- File Server: File Copy
- File Server: Audit File Access
- File Server: Storage growth reporting
- Licensing/Pricing
- Contact
This help page is for version 8.2. The latest available help is for version 9.4.
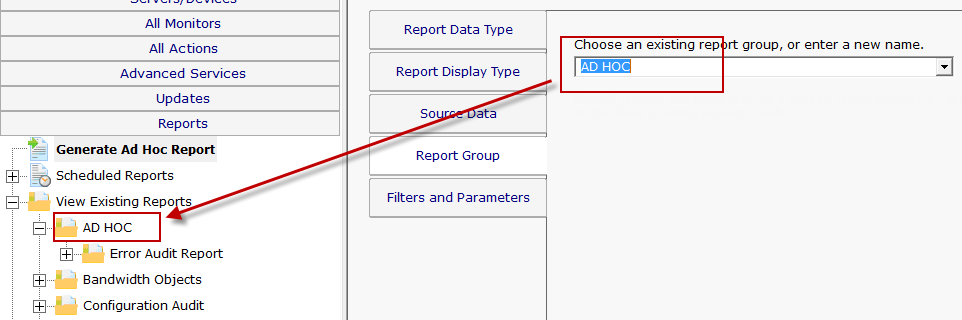
Running a report in PA File Sight is very easy. You start by going to the Reports node, and then to either Generate Ad Hoc Report, or right-click on Scheduled Reports.
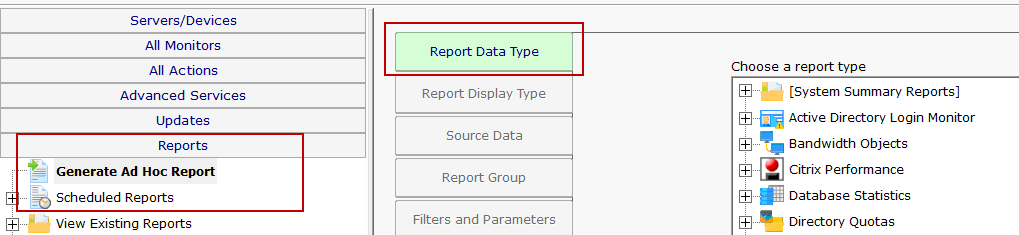
On the right side are all of the different report types. In general you would want to go to the monitor that is collecting the data that you want to run a report on. In this example we'll select the Active Directory Login Monitor. You might have different monitor/report types listed based on your product and license.
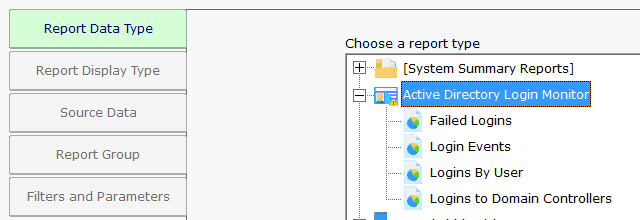
Once you've selected the report type, visit each of the tabs on the left to make selections.
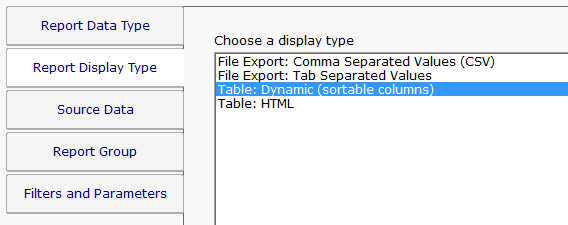
The Report Display Type tab lets you select the output format for the report. The "Table: Dynamic" is a popular report format that shows a dynamic table in the output. For very large reports (thousands of lines of output), the CSV report might be preferred as Excel usually handles large amounts of database better than a browser.
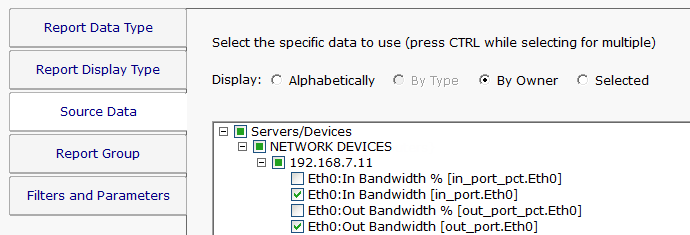
The Source Data tab is where you select which data set to use. For some report types there might only be a single selection. For the image below we chose the Bandwidth monitor report type in order to show how this looks when there are multiple data sets to choose from.
Report Groups are an easy way to get similar reports grouped together. This is purely for your organizational use. If the value is left blank the reports will get added to the Ad Hoc group. This is most useful for cases where there are many Scheduled Reports that a group of people will refer to often.
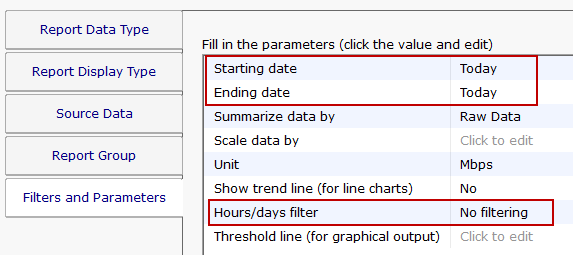
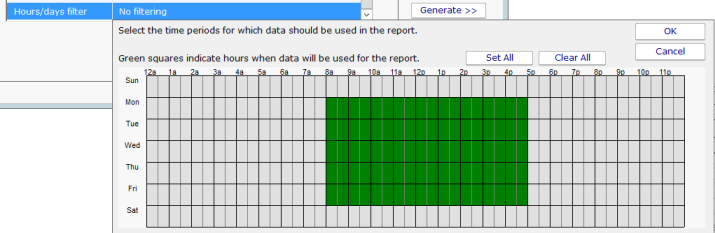
The most important tab for most reports is Filters and Parameters. This is where you really define what the report should show. The list of fields shown will be different for each report type. Most reports have a few fields in common:
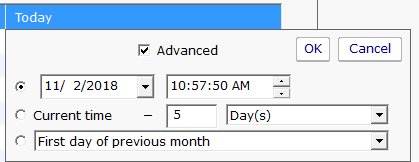
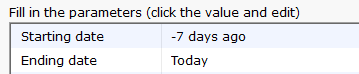
Once you've made your selection, the date is converted into a relative date from today so the report can be run on any date to give the desired results.
If you choose to create a Scheduled Report ran than running an Ad Hoc Report, there is an additional tab for emailing the report and/or saving the report data.
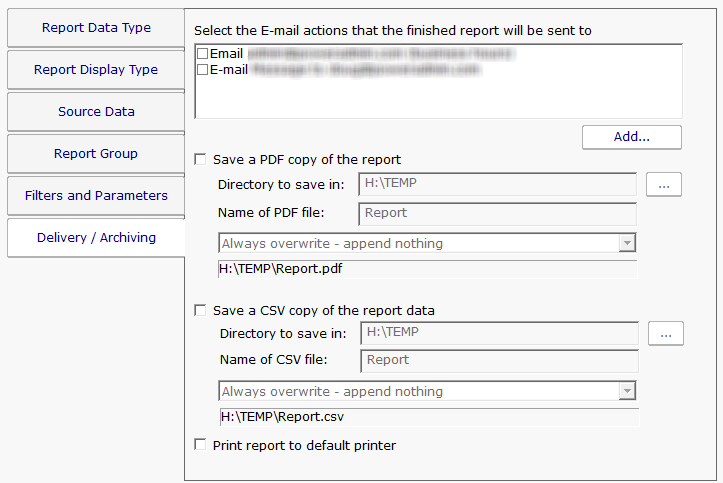
If saving a CSV or PDF file, it is recommended to save it to a local drive. If it must be a remote drive, specify the folder using a UNC path as mapped drive letters are not available to service processes.