- Compare Editions
- Product Information
- Pricing/Licensing
- Resources
- Support
- Contact
Monitoring remote servers, even across firewalls and the Internet
Ultra
Pro
Lite
Free
Safely send data to remote networks using SNAP Tunnels
Ultra
Pro
Lite
Free
Securely connect to monitored servers with Remote Desktop even through firewalls and across the Internet with PA Server Monitor
Ultra
Pro
Lite
Free
 Action Scheduler
Automate common IT tasks with the Action Scheduler. It will run your defined Actions when you specify.
Ultra
Pro
Lite
Free
 Active Directory Change Monitor
Monitor creation, deletion, and changes of the Active Directory objects.
Ultra
Pro
Lite
Free
 Active Directory Login Monitor
Monitor login and other security-related activity in Active Directory, Domain servers, and even for local logins.
Ultra
Pro
Lite
Free
 All-Systems-GO
Reports to the All-Systems-GO service which can notify you if the monitoring installation is affected in any way that would prevent its from alerting.
Ultra
Pro
Lite
Free
 Bandwidth Monitor
Monitor bandwidth, network error counts, broadcasts and other values from SNMP-based devices as well as from Windows Performance Counters.
Ultra
Pro
Lite
Free
 Calculated Status Monitor
This monitor lets you calculate its status by running a script on the statuses of other monitors.
Ultra
Pro
Lite
Free
 Citrix Presentation Server Monitor
Monitor and alert on Citrix XenApp (Presentation Server) client connect and login response times. Alert if too slow, and record times for historical charts.
Ultra
Pro
Lite
Free
 Database Monitor
The Database Monitor watches individual databases, and keeps an eye on the database size and transaction log sizes.
Ultra
Pro
Lite
Free
Database Server MonitorThe Database Server Monitor can watch that individual databases are up and running, and alerts if databases are added or deleted from a server.
Ultra
Pro
Lite
Free
 Directory Quota Monitor
The Directory Quota Monitor keeps track of directory sizes, and executes actions if the directory sizes are over the quota. End users (directory owners) can be notified via email with the Monitor-Directed E-mail action. Includes reports.
Ultra
Pro
Lite
Free
 Disk Space Monitor
Monitor the free disk space on server drives. You can set the warning threshold in absolute size, or percentage of disk space. Includes reports and auto-configuration.
Ultra
Pro
Lite
Free
 DNS Monitor
Monitor the results of a DNS lookup, or a reverse DNS lookup. You can specify which DNS server the request should be sent to. If an unexpected result is returned, actions are fired.
Ultra
Pro
Lite
Free
 Dynamic Server List
Dynamic Server Lists are groups of serves that meet your criteria. Once the list is known, you can define Dynamic Groups based on the list, and use that group everywhere else groups are used.
Ultra
Pro
Lite
Free
 Email Monitor
Monitor email messages in a POP3 or IMAP4 mail box for messages that contain specific text. When a match is found, alerts are fired.
Ultra
Pro
Lite
Free
 Environment Monitor
Connects to an Esensors EM01b Websensor on the LAN and monitors the current temperature, humidity and luminescence, and notifies you if the values go above thresholds that you set. Historical reports as well.
Ultra
Pro
Lite
Free
 Event Log Monitor
Checks any specified Windows Event Logs (Application, System, Security plus custom event logs) and executes actions you specify if a source you're interested in adds an event to the log.
Ultra
Pro
Lite
Free
 Event Validator Monitor
Verifies that specific events, such as backup succeeded or anti-virus pattern file updated events are in the event log. If they are missing, fire alerts.
Ultra
Pro
Lite
Free
 Execute Scripts
Execute your custom written scripts written in the Visual Basic Scripting Edition language. You can use custom or 3rd party ActiveX controls. The script determines whether to trigger actions using your own logic.
Ultra
Pro
Lite
Free
 File Age Monitor
Monitor file ages and alert if the files become too old (good for watching server queues, spool directories, etc).
Ultra
Pro
Lite
Free
 File/Directory Size Monitor
Track the size of a directory or a set of specific files within a directory. Includes reports.
Ultra
Pro
Lite
Free
 File & Directory Monitor (CIFS Monitor)
This monitor is a host-based IDS (Intrusion Detection System) that will notify you when the date, size or even content of a file changes on local files, or files on any CIFS share. File creation and deletion is also monitored. A good tool to help with configuration management as well. Auto-configuration functionality is available.
Ultra
Pro
Lite
Free
 File Synchronizer
A global monitor that can be used to synchronize files between the Central Server and Satellite servers.
Ultra
Pro
Lite
Free
 FTP Server Monitor
The FTP Server monitor can login to FTP servers (including SSL-enabled FTP servers) to make sure they are up and running.
Ultra
Pro
Lite
Free
 Hardware Monitor
Monitor the hardware status of ESX, Dell DRAC/iDRAC, HP iLO, IBM RAS and other IPMI-based devices.
Ultra
Pro
Lite
Free
 Hyper-V Replication
Monitor and alert on the current state of Hyper-V VM replication.
Ultra
Pro
Lite
Free
 Inventory Alerter
Alerts on inventory data collected by the Inventory Collector monitor.
Ultra
Pro
Lite
Free
 Inventory Collector
Collects inventory information (hardware information, pending Windows Update, anti-virus status, etc) from a variety of sources including WMI, SNMP and an optional System Details application.
Ultra
Pro
Lite
Free
 Log File Monitor
Periodically checks the content of one or more log files for target text. Target text and be a simple text phrase or a regular expression.
Ultra
Pro
Lite
Free
 Mail Server Monitor
Monitor your mail servers (POP3, IMAP & SMTP) and validate that they are running and accepting incoming connections.
Ultra
Pro
Lite
Free
 Modbus Monitor
Monitors and alerts on Modbus device metrics according to the definitions given.
Ultra
Pro
Lite
Free
 Network Scan
The Network Scan monitor will periodically perform a ping scan of a specified IP address range looking for new devices that are not already being monitored. They can automatically get added to the system and configured for monitoring.
Ultra
Pro
Lite
Free
 Performance Monitor
The entire breadth of the system Performance Counters can be monitored allowing you to set actionable thresholds on CPU usage, memory usage, NIC traffic, etc. Performance counter values are stored in a database so you can view historical counter reports and understand trends.
Ultra
Pro
Lite
Free
 Ping Monitor
Tests a connection/device by periodically testing it with a ping. No response or too great a delay triggers actions. Ping response times are recorded in a database for reporting and graphing.
Ultra
Pro
Lite
Free
 Plugin Monitor
Runs an executable or external script launched via Windows, or via SSH, and parses the output to determine whether alerts should be fired. Plugins can also return values that are recorded to the database and can be charted.
Ultra
Pro
Lite
Free
 Process Monitor
Monitor that specified processes are running on Windows or Linux servers.
Ultra
Pro
Lite
Free
 RD Gateway
Monitor Remote Desktop Gateways and show currently connected sessions on a dashboard
Ultra
Pro
Lite
Free
 Server Temperature Monitor
Using the free SpeedFan utility, the Server Temperature Monitor will watch the values from the various temperature probes on your server and notify you if they go above the thresholds you set.
Ultra
Pro
Lite
Free
 Server Time Monitor
Compare a Windows server's clock against an NTP server and alert if over a configuable threshold.
Ultra
Pro
Lite
Free
 Service Monitor
Watches system services and runs customized actions (including restarting the service) if they are not running.
Ultra
Pro
Lite
Free
 SNMP Monitor
Connects to local or remote SNMP agents and queries SNMP object values. Custom MIBs are supported. The value is compared to a threshold that you set and actions are fired as specified. SNMP values are also recorded to a local database for reporting purposes. Supports SNMP v1, v2c and v3.
Ultra
Pro
Lite
Free
 SNMP Trap Monitor
Receives SNMP Traps and optionally filters on trap text before running attached actions.
Ultra
Pro
Lite
Free
 Syslog Monitor
Receives Syslog log events and optionally filters on incoming log text before running attached actions.
Ultra
Pro
Lite
Free
 System Audit Monitor
A global monitor that allows watching for internal audit events (that can be reported on via the Monitoring System Audit report) which can be alerted on or forwarded to other SIEM systems.
Ultra
Pro
Lite
Free
 Task Scheduler
Monitors the enable/disable status and the Last Run Result value of Windows Task Scheduler tasks.
Ultra
Pro
Lite
Free
 TCP Port Monitor
Makes a TCP connection on a specified port. Optionally send command text and check response text. Timing data is recorded for reporting purposes.
Ultra
Pro
Lite
Free
 Web Page Monitor
Monitor one or many pages on a web site. Checks for positive cases (text that must be found), negative cases (alerts if error text found) and if the page has changed at all. Response times are checked and recorded, and reports can be generated to understand trends.
Ultra
Pro
Lite
Free
 Action List
Groups of actions for common notifications, group notifications, etc.
Ultra
Ultra
Ultra
Ultra
 Call URL
This action will call a URL you specify, optionally posting information about the current alert. This makes it easy to connect to a helpdesk/ticketing system.
Ultra
Ultra
Ultra
Ultra
 Desktop Notifier
Delivers alerts to Windows desktops via a pop-up message box or a slider in the lower right corner of the screen.
Ultra
Ultra
Ultra
Ultra
 Dial-Up Connection
Connects or disconnects a Windows Dial-up Connection. Typically this is for servers that are not on the Internet, but need to connect to send alerts.
Ultra
Ultra
Ultra
Ultra
 E-mail Alert
Sends SMTP email messages to mail boxes, cell phones, mobile devices, etc. The E-mail action has Alert Digests which are a powerful/friendly feature that combines multiple alerts that happen within a short time into a single email notification. This can be very helpful when something goes really wrong. You can easily specify when messages should be sent or suppressed.
Ultra
Ultra
Ultra
Ultra
Execute ScriptSimilar to the Execute Script monitor, this Action lets you extend the list of available actions via your own script written in VBScript. Many variables from the source monitor are also available for creating rich, situation-specific responses.
Ultra
Ultra
Ultra
Ultra
 Message Box
A simple message box that displays monitor findings. These message boxes are smart: if there are many pending alerts you can easily dismiss them all at once.
Ultra
Ultra
Ultra
Ultra
Monitor-Directed EmailThe monitor which detects a problem specifies the email address to use for each alert. This is very useful when sending reminders and alerts to end users such as with the User Quota Monitor and the Directory Quota Monitor.
Ultra
Ultra
Ultra
Ultra
 Network Message (Net Send)
Sends a message box containing the critical monitor details to every place that you are logged in.
Ultra
Ultra
Ultra
Ultra
 Pager Alert via SNPP
Send monitor results to pagers via standard Simple Network Paging Protocol (SNPP). You can easily specify when messages should be sent or suppressed, and the content of the message.
Ultra
Ultra
Ultra
Ultra
 PagerDuty Integration
Send alerts directly to your PagerDuty account and track them using the full power of the PagerDuty platform.
Ultra
Ultra
Ultra
Ultra
 Phone Dialer (DTMF/SMS)
Dials a modem/phone and optionally sends DTMF commands or other commands (to send SMS messages for example). This is typically used by a disconnected server to send an alert over a normal phone line (where the CallerID identifies the server)
Ultra
Ultra
Ultra
Ultra
 Play Sound
Audible alert when monitors detect a problem with the server.
Ultra
Ultra
Ultra
Ultra
 Reboot Server
Reboots the server if a monitor has detected a critical system failure.
Ultra
Ultra
Ultra
Ultra
 Run Report
When this action is triggered, it will run the specified Scheduled Report including sending any emails or saving PDF or CSV files that report requires.
Ultra
Ultra
Ultra
Ultra
 SMS Text Message
Send SMS text messages to your mobile device via your service providers SMS Internet gateway (SMPP server). You can control which information gets sent, as well as when messages are allowed.
Ultra
Ultra
Ultra
Ultra
 Server Maintenance
Set or remove the Immediate Maintenance period for a server or servers
Ultra
Ultra
Ultra
Ultra
SNMP TrapSends an SNMP Trap with details from the monitor firing the action
Ultra
Ultra
Ultra
Ultra
 Start Application
Starts a specified application when the monitor triggers actions
Ultra
Ultra
Ultra
Ultra
Start Scheduled TaskStarts or Stops a Windows Scheduled Task
Ultra
Ultra
Ultra
Ultra
 Start Service
Sends control messages to the Windows Service Control Manager to start, stop or restart a specified service.
Ultra
Ultra
Ultra
Ultra
SyslogSends monitor alerts to a Syslog server on the network
Ultra
Ultra
Ultra
Ultra
 Wait
WaitThe Wait action can be used to introduce delay in a list of actions that are run. This can be used directly by monitors as well as in Action Lists.
Ultra
Ultra
Ultra
Ultra
Write to Event LogWrites monitor details to the Windows Event Log.
Ultra
Ultra
Ultra
Ultra
 Write to Log File
Log the findings of any triggered monitor to a file. Separate files can be created for each day, week, month, etc.
Ultra
Ultra
Ultra
Ultra
Generate reports on the fly to quickly see graphical trends
Ultra
Pro
Lite
Free
Easily brand reports with your company logo at the top
Ultra
Pro
Lite
Free
Group summary reports can be specified and controlled in a per-group way. In addition, group reports can be automatically emailed to anyone that needs to keep track of the servers.
Ultra
Pro
Lite
Free
Reports are generated in HTML and accessible from within the PA Server Monitor Console application, or from a web browser
Ultra
Pro
Lite
Free
Collect and report on hardware and system inventory of the monitored servers and devices.
Ultra
Pro
Lite
Free
Combines and shows multiple bandwidth charts on an efficient set of one or more graphs.
Ultra
Pro
Lite
Free
Password protect web reports in PA Server Monitor
Ultra
Pro
Lite
Free
Quickly see the current status of an individual Satellite Monitoring Service.
Ultra
Pro
Lite
Free
Two reports that let you see the status of all of the Satellites at once.
Ultra
Pro
Lite
Free
You can create scheduled reports which will get created when you want them, and optionally email the report to a list of recipients. Scheduled report URLs are stable so you can add them to your Favorites list to quickly and easily see the latest results.
Ultra
Pro
Lite
Free
Easily see at a glance the state of your server along with system statistics
Ultra
Pro
Lite
Free
Quickly see which monitors are running, how long they are taking, which actions are being fired and more.
Ultra
Pro
Lite
Free
View the tabs and information that is common among most report types.
Ultra
Pro
Lite
Free
Uptime Reports can be run on many different types of data, with summarization at the raw, hourly, daily, weekly and monthly level.
Ultra
Pro
Lite
Free
The All Errors report show all recent errors on all monitors on all servers/devices within a group. This is a good place to quickly get a detailed view of any problems happening on the network.
Ultra
Pro
Lite
Free
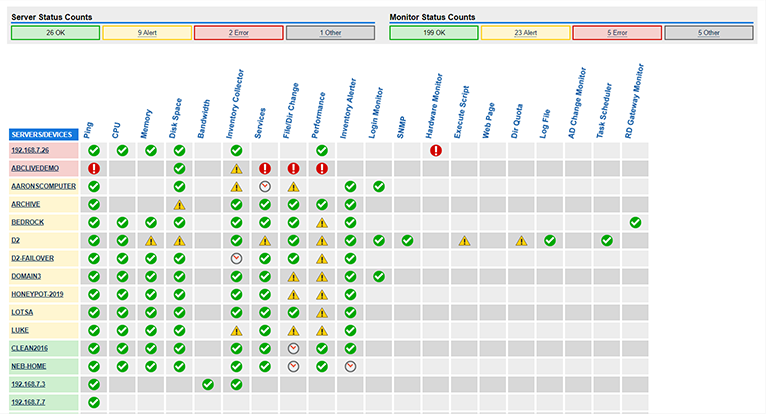
This report shows all of your servers in a group in a single page. Each server is a small box that is color coded according to the status of the monitors on that server.
Ultra
Pro
Lite
Free
Create custom reports at a group level to show custom HTML, charts, and other status values for the contained servers.
Ultra
Pro
Lite
Free
A compact report that shows high-level server health with detailed monitor types in a column layout.
Ultra
Pro
Lite
Free
See a one line status indicator per server to see at a glance how the servers in your data center are doing. Per-group status reports are also supported.
Ultra
Pro
Lite
Free
View all of the servers/devices within a group in a single report, grouping all computers and showing their status.
Ultra
Pro
Lite
Free
See a graphical map that contains status indicators that show you at a glance how servers in different geographic regions are doing.
Ultra
Pro
Lite
Free
This report shows you what your current configuration is with your Groups, Servers, Monitors, and Actions.
Ultra
Pro
Lite
Free
See all sessions (Console, Satellite, mobile apps) currently connected to the Central Service.
Ultra
Pro
Lite
Free
Powerful report to look at current and past alert conditions that have been detected by the system.
Ultra
Pro
Lite
Free
Displays a summary of what is being monitored on a per-group basis. This would be appropriate to show stake holders to indicate the level of monitoring work being done.
Ultra
Pro
Lite
Free
A quick table-based overview of current monitor statuses. You can specify a specific monitor type, only monitors in error, etc.
Ultra
Pro
Lite
Free
This report looks at the current security settings and grades them on a 1 (worst) to 5 (best) scale. It is a good place to check how secure the installation is against attack.
Ultra
Pro
Lite
Free
View system statistics such as HTTPS connections and data transferred, numbers of monitors and connected Satellites, etc.
Ultra
Pro
Lite
Free
Find out about activities within the monitoring system, such as alert emails sent, user logins, Satellite disconnects, etc.
Ultra
Pro
Lite
Free
This report will display all users defined in the system, what they have access to, and their permissions.
Ultra
Pro
Lite
Free
While a computer is in maintenance mode, PA Server Monitor won't run monitors. It will turn itself back on automatically after the maintenance window expires if you manually entered maintenance mode, or it can automatically enter and leave maintenance mode on a schedule.
Ultra
Pro
Lite
Free
Setup a second instance of PA Server Monitor to monitor the primary monitoring service, and take over if it fails
Ultra
Pro
Lite
Free
Perform changes of settings in actions, monitors, reports and scheduling for several servers at one time, or copy configuration settings to other servers.
Ultra
Pro
Lite
Free
Password protect the PA Server Monitor Console, and alert on changes that could affect monitoring.
Ultra
Pro
Lite
Free
Easily point PA Server Monitor at the embedded SQLite database or use an external Microsoft SQL Server.
Ultra
Pro
Lite
Free
"...hands down the most straight-forward, uncluttered and effective monitoring tool I have used" - A satisfied customer
Ultra
Pro
Lite
Free
Control the HTTP port that PA Server Monitor uses, and optionally enable HTTPS (SSL)
Ultra
Pro
Lite
Free
Keep track of which errors have been reviewed and acknowledged. Also a great way for administrators to have an overview of any errors within their area of responsibility.
Ultra
Pro
Lite
Free
Many monitors are capable of sending escalating events. For example, low disk space alerts could first go to a first-tier Ops team. If the aren't handled in a specified time frame, they could be forwarded to a second-tier Ops team.
Ultra
Pro
Lite
Free
Send basic configuration requests to the product via an HTTPS URL.
Ultra
Pro
Lite
Free
Collect and report on hardware and system inventory of the monitored servers and devices.
Ultra
Pro
Lite
Free
PA Server Monitor for iPhone lets you stay up to date even if you're away
Ultra
Pro
Lite
Free
PA Server Monitor for Android lets you stay up to date even if you're away
Ultra
Pro
Lite
Free
PA Server Monitor for Windows lets you stay up to date even if you're away
Ultra
Pro
Lite
Free
PA Server Monitor is composed of a console that you interact with, and a system service that is started when the computer boots up and is always running in the background.
Ultra
Pro
Lite
Free
Group servers together in visual groups to help keep track of them. Group-based status reports are also available.
Ultra
Pro
Lite
Free
Easily brand PA Server Monitor to have your name and graphics by simply dropping a couple of files into the installation directory. See Branding
Ultra
Pro
Lite
Free
Takes less than 3 minutes to install and get a default installation customized for your system.
Ultra
Pro
Lite
Free
Paste a list of servers or IP address into a list and let PA Server Monitor inspect and self-configure for each server/device. Or easily copy the configuration from one configured server to one or more other servers.
Ultra
Pro
Lite
Free
Monitor aspects of a VMWare ESX host server.
Ultra
Pro
Lite
Free
Fully functional 30 day free trial. Trial extensions available.