- Solutions
-
- File Server: Ransomware Protection
- File Server: File Copy
- File Server: Audit File Access
- File Server: Storage growth reporting
- Licensing/Pricing
- Contact
This help page is for version 5.0. The latest available help is for version 9.4.
The Group Overview Report is a great mix of high level and detailed view. Here you can see servers and specific server health metrics along with monitor types. Problem servers are always floated to the top, so if a server isn't on the screen, you don't need to worry about it.
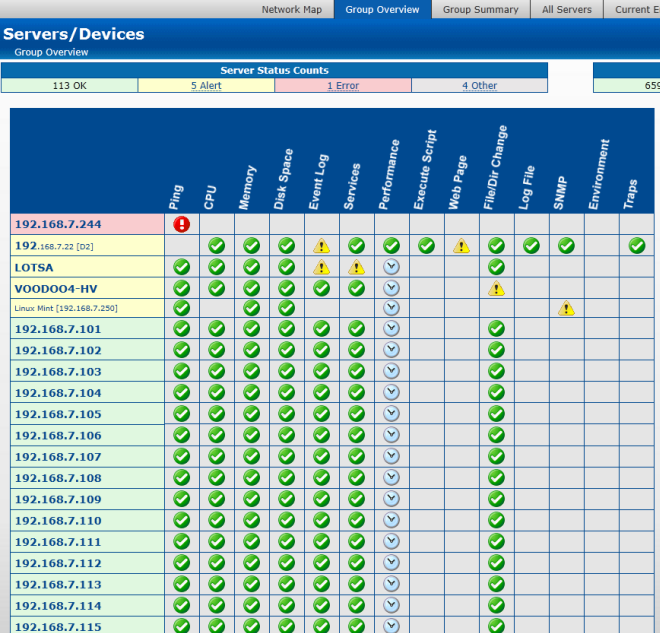
Green arrows represent a monitor with a healthy status. Yellow and red indicate a monitor has detected a problem. A grey clock means the server or monitor is disabled or in a maintenance period. If a cell is empty, it indicates that particular server/device doesn't have a monitor of the type specified in the column header.