This help page is for version 4.0. The latest available help is for version 9.4.
Ad Hoc Reports
Ad hoc reports can be generated at any time to quickly gather historical and current data on your systems. Simply click through each tab and make the selection that is presented on that tab. Note that the reports present in your application may differ from those shown in the image below.
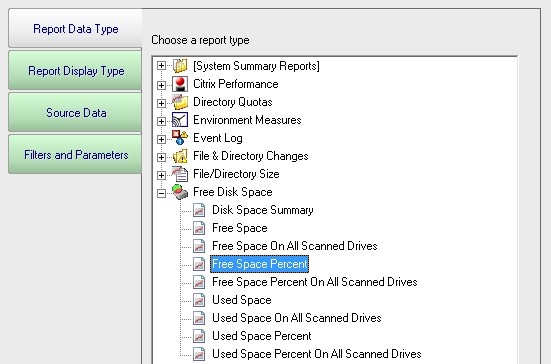
In the example below, the user is on the top Report Data Type tab. Report Types are defined by the monitors installed on the system (the monitors are what store the data, and they also create the reports). In this case, the user has selected the Free Disk Space report type, and specifically the Free Space Percent report. The remaining tabs have turned green to indicate that they still need to be visited.
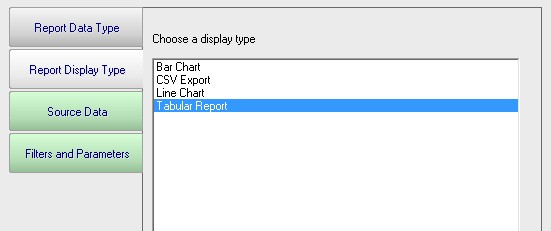
On the Report Display Type we see that this particular report can be represented as a Bar Chart, CSV Export, Line Chart or Tabular Report. The Tabular Report will create a dynamic HTML table with sortable column headers. The CSV Export is a .csv file which can easily be imported into Excel and other applications. Some report display types won't make sense for some data types -- in that case, the display type will not be shown.
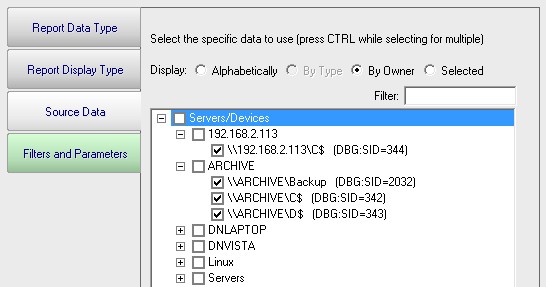
After having selected the report type and the display format, it's time to choose which data to report on. This is done on the Source Data tab. This tab will display all of the data that is available for the chosen report type. In this case we are shown drives that can be reported on. The radio buttons at the top display the available data sets in different ways. In addition, the Filter box will filter the displayed items down to entries that contain text that you enter. This makes finding a particular data set from a very large list quick and easy.
Check the box next to the data set(s) that you want to report on. You can also place the check at a higher level in the data set tree and all data sets below it will also get checked.
NOTE: Most data sets can be deleted. Although not shown in this screenshot, there is a "Delete selected data sets" button near the bottom of this dialog. Clicking that button will delete the data for the checked data sets from the database.
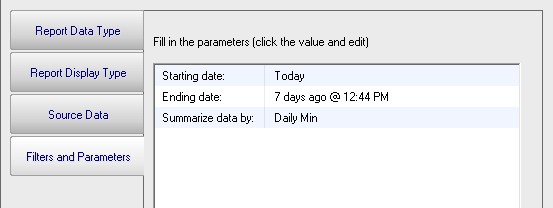
The final tab is Filters and Parameters. The filters and parameters shown depend on which report type you are creating. Most data sets have the ability to specify a time span for the report. Many report types also have summarization abilities like the example below. Summarizing allows you to take a large data set and summarize it into a smaller amount of data. That is done by taking a set of values (an hour, day, week or month's worth) and computing the minimum, maximum or average value for that period.
When you press the Generate Report button you will be taken to a "Report Generation in Progress" page, and then automatically forwarded to the finished report.
Since the reports are HTML pages, you can open a report in a regular browser, print the report, generate a PDF, etc. To see the URL for the finished report, scroll all the way to the bottom.
Report Troubleshooting
If a report doesn't show the data that you expect, check the following:
- Check the time frame the report is using (bottom tab in the graphic above). Often the time frame excludes available data.
- Consider when the report is run and when data collection happens. If you run a report at 1am, but the monitor first collects data at 2am, a report for Today won't have anything to display.
- Double-check the Filter and Parameters tab for other settings. Some times the parameters end up excluding data that you want.
- Make sure the data set selected in the Source Data tab is what you expect.