- Solutions
-
- File Server: Ransomware Protection
- File Server: File Copy
- File Server: Audit File Access
- File Server: Storage growth reporting
- Licensing/Pricing
- Contact
This help page is for version 5.6. The latest available help is for version 9.4.
The Network Map gives you a quick overview of the health of the network in a single view. All of the servers, including those at remote sites, will be shown on the report, and the report will automatically be resized to fit the report window.
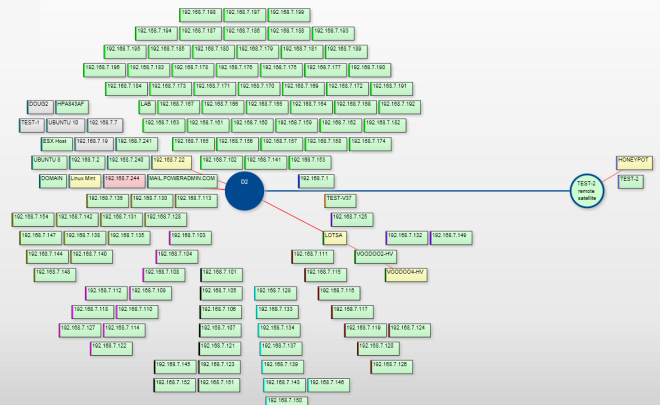
In the image above, each box represents a server or device. The blue circles are monitoring stations. In this example, the solid blue Central Monitoring Service is D2. There is also a Satellite Monitoring Service (blue circle, fill green) named TEST-2.
The left edge of each box is colored. This helps to visually group the server boxes, which are also laid out according to group.
If a server is red or yellow, there will be a red line from the monitoring node to the box -- this helps identify which node is monitoring that particular server/device which may not always be as obvious as the example image.
If a Satellite is not connected, the Satellite circle will be blue, but filled yellow. All servers/devices monitored by that Satellite will also be yellow.
Clicking a box will take you to the Server Status Report for that server. In addition, you can view a Network Map for any group, and just that group's servers/devices will be shown.